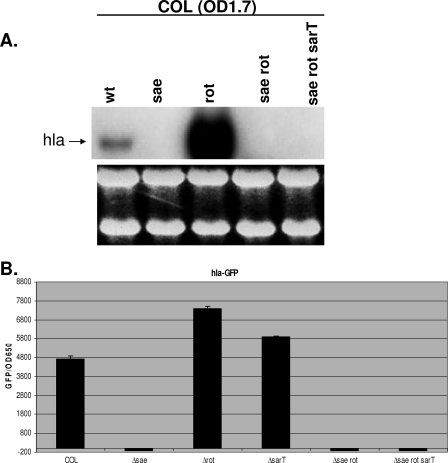
FIG. 1.
Transcription of hla in COL and its isogenic mutants. (A) Northern blot analysis of hla. RNA was harvested from cells grown to an OD650 of 1.7 (OD1.7) at a time when hla expression was expected to be the strongest. One typical blot with RNA with an OD650 of 1.7 is shown. An RNA gel below shows equal sample loadings. wt, wild type. (B) The expression of GFP driven by the hla promoter was measured. The fluorescence and cell density (OD650) were measured hourly for 10 h and then overnight by transferring aliquots (200 μl) to microtiter plates in triplicate. The results from one time point (8 h; OD650 of 1.7) of promoter activation are shown and are plotted as mean fluorescence divided by the OD650 using average values from triplicate readings.

