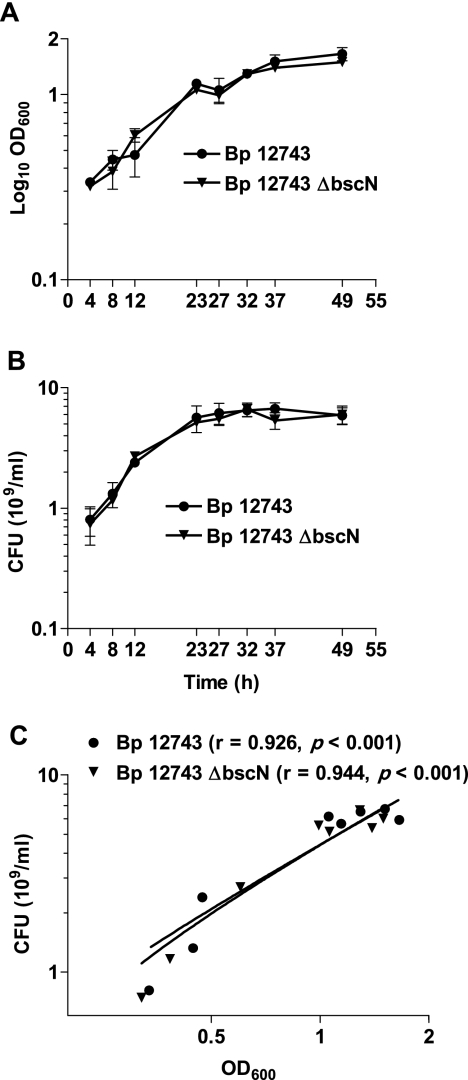
FIG. 3.
Correlation between in vitro growth curves for B. pertussis (Bp) 12743 and ΔbscN B. pertussis 12743. B. pertussis 12743 and ΔbscN B. pertussis 12743 were cultured for 2 days in SS medium, and samples were removed at the indicated time points. (A) OD600 was determined. (B) The number of viable bacteria was determined by performing CFU counts after plating on BG agar. (C) CFU counts were plotted against OD600 for each strain separately, and linear regression analysis was performed. The correlation (r value) and level of significance (P value) are shown.

