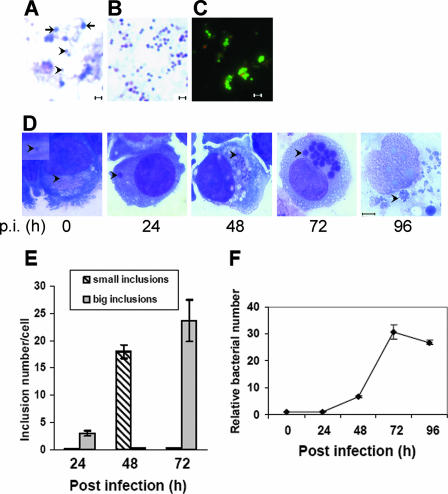
FIG. 1.
E. chaffeensis development in synchronously infected THP-1 cells. (A) Mixed developmental forms of E. chaffeensis liberated from infected THP-1 cells. The fragile RCs are indicated by arrows. The sonication-resistant DCs are indicated by arrowheads. Bar = 1 μm. (B) E. chaffeensis DCs are enriched after vigorous sonication. Cells were stained using Diff-Quik stain. Bar = 1 μm. (C) LIVE/DEAD BacLight bacterial viability test of E. chaffeensis DCs. Green indicates live bacteria, and red indicates dead bacteria. Bar = 1 μm. (D) Synchronously cultured E. chaffeensis in THP-1 cells using DCs as the inoculum. The bacteria or morulae are indicated by arrowheads. The inset shows a single bacterium associated with a host cell at 0 h p.i. All images show Diff-Quik staining of cells. Bar = 5 μm. (E) Numbers of small (<2-μm) and large (>2-μm) inclusions at different times after infection. One hundred infected THP-1 cells were scored at each time point. The values are the means ± standard deviations for three specimens. (F) Synchronous growth of E. chaffeensis determined by quantitative PCR. Genomic DNA extracted from infected THP-1 cells at different times after infection was subjected to real-time PCR analysis. The data indicate the numbers of bacteria relative to the number at 0 h p.i. The values are the means ± standard deviations for three specimens.

