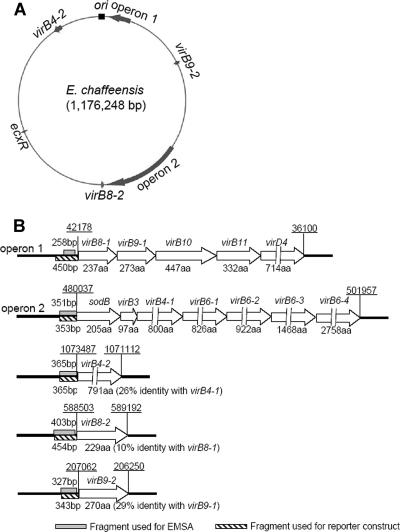
FIG. 2.
virBD gene loci and probe locations. (A) virBD gene loci on the E. chaffeensis genome. The genome map of E. chaffeensis is shown as a circle. The putative origin of replication (ori) is indicated by a black box. The virBD gene loci are indicated by gray arrows. Operon 1 includes virB8-1, virB9-1, virB10, virB11, and virD4. Operon 2 includes sodB, virB3, virB4-1, virB6-1, virB6-2, virB6-3, and virB6-4. The length of each arrow is eight times the length of the locus in the genome. (B) Schematic diagram of virBD gene loci and probe locations. virBD genes are represented by open arrows. The gene designations are above the arrows, and the numbers of amino acids (aa) in the corresponding gene products are indicated below the arrows. The lengths of virD4, virB4-1, virB4-2, virB6-1, virB6-2, virB6-3, and virB6-4 are not proportional, as indicated by discontinuous arrows. The upstream regions amplified by PCR to create DNA probes for EMSAs (shaded boxes) and for lacZ reporter constructs (hatched boxes) are indicated. The levels of amino acid sequence identity of the duplicated genes are indicated in parentheses. Chromosomal coordinates (underlined) are indicated above loci at the start and end of operons or genes.

