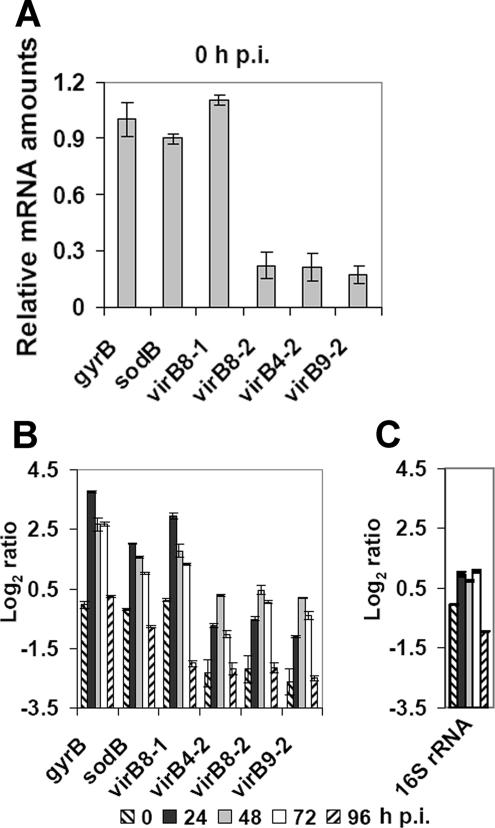
FIG. 3.
Temporal expression of virBD genes in E. chaffeensis. (A) Quantitative RT-PCR to determine the expression of the five virBD loci at 0 h p.i. The transcript levels are the levels relative to the amount of the gyrB transcript at 0 h p.i. The values are the means ± standard deviations for three specimens. (B) Quantitative RT-PCR to determine the temporal expression of the five virBD loci. Transcript levels at different developmental stages were normalized by using the E. chaffeensis 16S rRNA gene. The transcript levels are expressed as the log2 ratio of the amount of a transcript at an indicated time point to the amount of the gyrB transcript at 0 h p.i. The values are the means ± standard deviations for three specimens. (C) Quantitative RT-PCR to determine the temporal amounts of 16S rRNA. The 16S rRNA levels of E. chaffeensis at different developmental stages were normalized by using the E. chaffeensis 16S rRNA gene. The 16S rRNA levels are expressed as the log2 ratio of the amount at an indicated time point to the amount of 16S rRNA at 0 h p.i. The values are the means ± standard deviations for three specimens.

