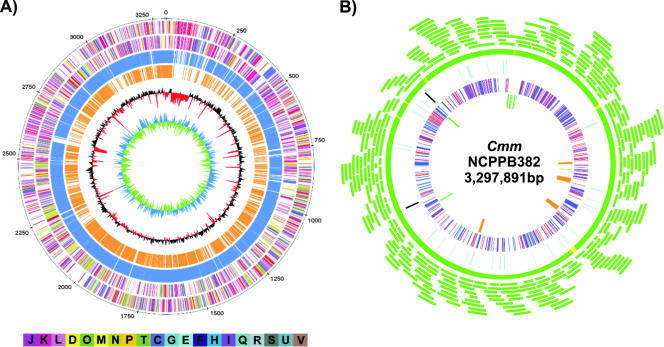
FIG. 1.
Circular diagrams of the C. michiganensis subsp. michiganensis strain NCPPB382 chromosome displaying relevant genome features and validation of the sequence assembly by a BAC map. (A) Circles providing the following information (from the outermost circle to the innermost circle): circle 1, position (in kilobases); circles 2 and 3, predicted CDS on the forward (circle 2) and reverse (circle 3) strands, with the colors indicating the assigned COG classes; circles 4 and 5, CDS with homologues in the chromosomes of C. michiganensis subsp. sepedonicus (blue) and L. xyli subsp. xyli (orange), respectively; circle 6, G+C content, showing deviations from the average value (72.66%); circle 7, GC skew. The bar at the bottom explains the colors used to indicate the functional COG groups (C, energy production and conversion; D, cell cycle control, mitosis, and meiosis; E, amino acid transport and metabolism; F, nucleotide transport and metabolism; G, carbohydrate transport and metabolism; H, coenzyme transport and metabolism; I, lipid transport and metabolism; J, translation; K, transcription; L, replication, recombination, and repair; M, cell wall and membrane biogenesis; N, cell motility; O, posttranslational modification, protein turnover, and chaperones; P, inorganic ion transport and metabolism; Q, secondary metabolite biosynthesis, transport, and catabolism; R, general function prediction; S, unknown function; T, signal transduction mechanisms; U, intracellular trafficking and secretion; V, defense mechanisms). (B) BAC map of the C. michiganensis subsp. michiganensis (Cmm) chromosome. Each green arc represents a single BAC clone mapped on the assembled sequence. From the outer circle to the inner circle: circle 1, coverage of the C. michiganensis subsp. michiganensis chromosome with BAC clones (green, covered by more than one BAC clone; yellow, covered by one BAC clone); circle 2, genes coding for tRNAs (cyan) and rRNAs (black); circle 3, predicted transporter proteins (blue) and transcriptional regulators (red); circle 4, genes putatively involved in pathogenicity (green) and EPS clusters (orange).

