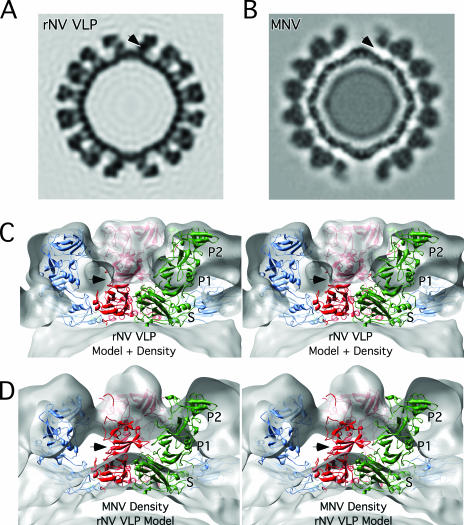
FIG. 1.
Cross sections of rNV VLP and MNV electron density maps. (A) Cross section of the rNV VLP electron density based on the known crystal structure (26) and calculated to a resolution of 12 Å. (B) Cryo-TEM electron density of MNV. (C) Stereo image of the magnified view of the calculated rNV VLP density superimposed with the structures of subunits A, B, and C colored blue, green, and red, respectively. (D) Stereo image of the cryo-TEM electron density of MNV in gray with the superimposed atomic model of rNV VLP for comparison. The black arrow in each panel shows the approximate location of the P1 domain in the rNV VLP structure. Note that this corresponds to a region void of density in MNV.

