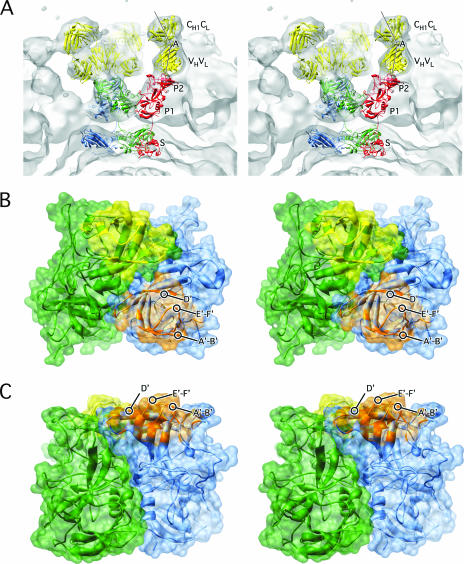
FIG. 6.
Details of the Fab/MNV model. (A) Stereo image of the fit of the modified rNV VLP structure and Fab1 into the cryo-TEM density of the MNV/Fab complex. The colors used for the atomic models are the same as in Fig. 5. The lines show the approximate locations of the pseudo-twofold axes in the variable and constant domains. The angle between these axes defines the “elbow angle.” (B) Stereo image showing the areas of the P2 domains that are in contact with the bound antibody. Here, ribbon diagrams are shown in translucent surface renderings of the P2 domains within A-B dimers in green and blue. The areas in contact with the two different Fab fragments are yellow and orange. The viewing angle is from the top of the P domain dimers, and panel C is a side view of the same structure.

