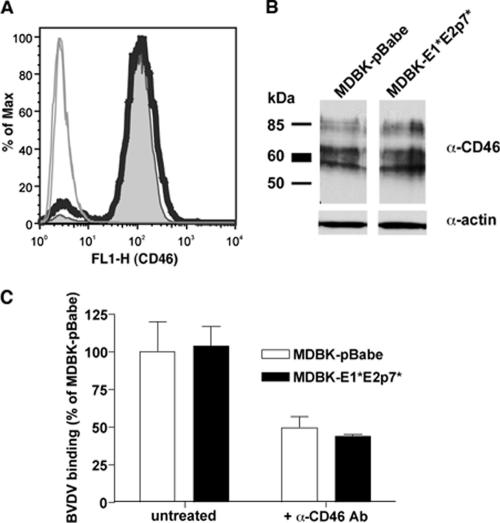
FIG. 7.
CD46 expression on MDBK-E1*E2p7* cells is similar to that in control pBabe cells. (A) To analyze CD46 expression on the cell surface, cells were detached and stained with a polyclonal antibody against bovine CD46. Cells were processed in the absence of detergent to selectively stain only the surface of the cells. CD46 expression on MDBK-E1*E2p7* (thick black line) and pBabe cells (tinted gray curve) was analyzed by fluorescence-activated cell sorting after gating on live cells. Results with cells stained with preimmune serum are indicated by thin solid lines. (B) To examine total CD46 expression, lysates from MDBK-E1*E2p7* and pBabe cells were analyzed by Western blotting with an antibody against bovine CD46 (α-CD46) or actin (α-actin). The presence of multiple bands in the anti-CD46 blot is due to multiple spliced isoforms of CD46 in the cell. (C) BVDV binding to MDBK-E1*E2p7* cells is similar to control pBabe cells. Cells were incubated for 1 h at 4°C with BVDV NADLJiv90− at an MOI of 10. Cells were washed extensively, and RNA was harvested for quantitative RT-PCR to determine cell-associated BVDV RNA levels. For bars marked +α-CD46 Ab, cells were pretreated with a mixture of anti-CD46 MAbs and then infected with BVDV as described above. Values are expressed as the percentage of untreated MDBK-pBabe BVDV binding. The data shown are the averages of at least duplicate samples; error bars show the standard deviations. Values shown for the untreated samples are representative of at least three independent experiments.

