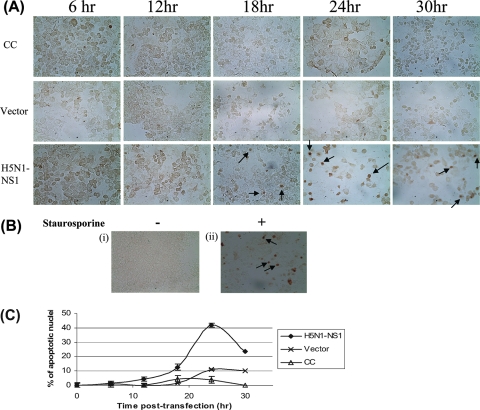
FIG. 2.
Apoptosis detected by the TUNEL assay. (A) Representative photographs showing the control and transfected cells stained for the detection of apoptotic nuclei by the TUNEL assay. The cells were harvested at 0, 6, 12, 18, 24, and 30 h posttransfection. Examples of apoptotic cells as indicated by positively stained nuclei are marked with arrows. Apoptosis was evaluated by counting the number of positively stained cells per field at a magnification of ×400. CC, untransfected control cells; vector, cells transfected with pcDNA4 empty vector; H5N1-NS1, cells transfected with pcDNA4-NS1. (B) Representative photographs showing the untransfected control cells not treated (i) or treated with the apoptosis-inducing agent staurosporine (0.5 μM) for 24 h (ii) and stained for the detection of apoptotic nuclei by the TUNEL assay. Examples of positively stained apoptotic cells are indicated by arrows. −, not treated; +, treated. (C) Percentage of apoptotic cells detected at various time points posttransfection using the TUNEL assay. Results are expressed as means ± standard deviations (SD) of results from three independent experiments.

