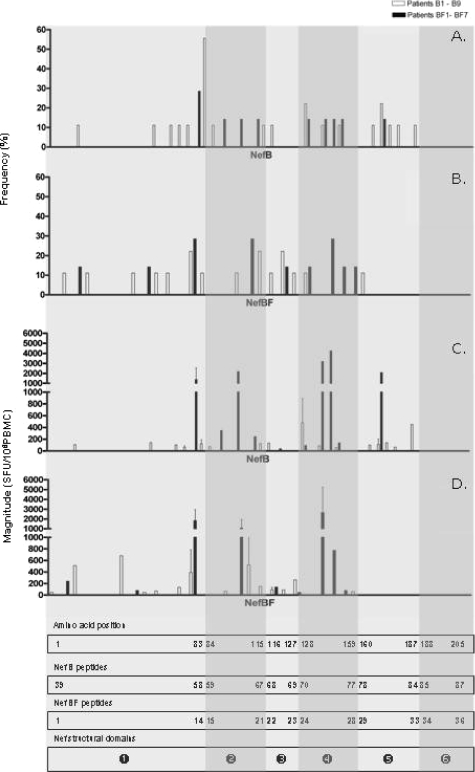
FIG. 2.
Histograms showing the frequency of respondents (A and B) and magnitude of responses (C and D) for all overlapping peptides. Histograms show all positive responses (by cutoff criteria described in Materials and Methods) obtained in patients infected with B (white bars) and BF (black bars) for peptides derived from both NefB (A and C) and NefBF (B and D). The median magnitude obtained for each peptide is shown together with SDs (error bars). The rectangles at the bottom of the figure show the amino acid numbering, peptide number within each peptide set (NefB and NefBF), and Nef structural domains. The HIV-1 Nef protein can be divided into six functional domains (depicted as white numbers of a solid black circle): the N-terminal domain (domain 1, aa 1 to 83), the N-terminal core (domain 2, aa 84 to 115), oligomerization domain (domain 3, aa 116 to 127), central core (domain 4, aa 128 to 159), loop (domain 5, aa 160 to 187), and C-terminal domain (domain 6, aa 188 to 205) (6). Regions encompassing each domain in each histogram are highlighted with different degrees of shading.

