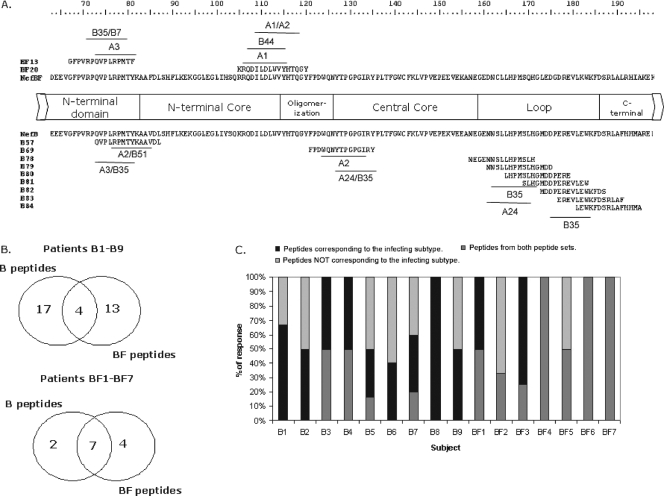
FIG. 3.
Fine mapping of responses, evaluated at the single-peptide level. (A) Nef domains encompassing aa 163 to 198 are shown together with NefB and NefBF primary structures. The most frequently recognized peptides are indicated. Also, the primary structures of subtype B peptides spanning the NefB loop are shown. This domain was targeted in an unexpected high frequency of patients (21%). Close to each peptide, putative restricting HLA alleles are shown as predicted using Web-based immunological tools. (B) Venn diagrams showing the absolute number of responses obtained using each peptide set for each patient group. Overlapping regions denote the number of responses detected with both peptide sets (i.e., concordant responses). (C) Bar graph showing the relative contribution of concordant and discordant responses to the total breadth in all patients enrolled. Dark gray portions stand for recognition of peptides corresponding to the peptide set derived from the same subtype than the infecting virus; light gray portions stand for recognition of peptides derived from the peptide set not corresponding to the infecting subtype, and black portions represent concordant responses.

