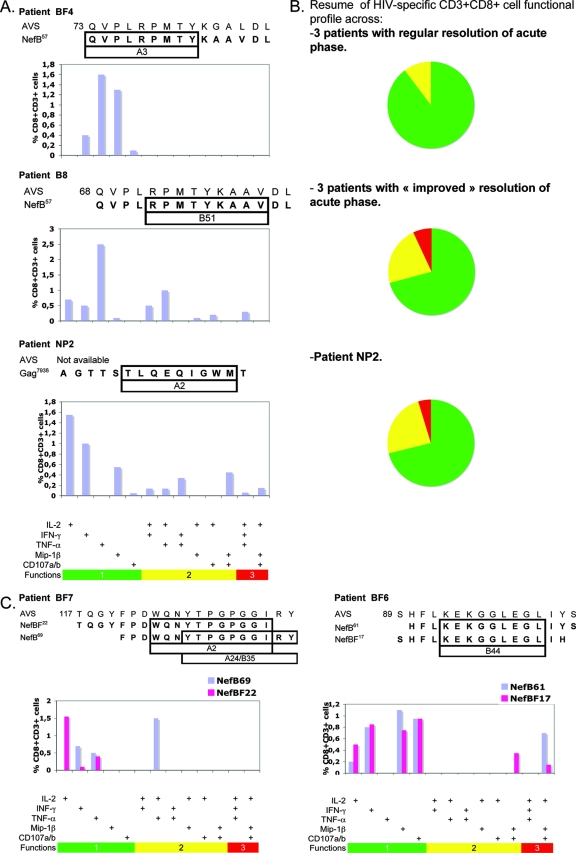
FIG. 6.
Functional profiles of specific CD8+ T cells. (A) Specific CD8 T-cell responses of a representative patient with regular resolution of acute phase (patient BF4), of a patient with “improved” control of acute phase (patient B8), and of patient NP2. For each patient, the peptide used as stimulus is shown aligned to the autologous viral sequence (AVS) (numbers to the left of the sequence indicate the amino acid positions within the Nef protein) and putative restricting HLA allele. Vertical bars represent the frequency of CD8+ T cells expressing the particular combination of functions indicated on the x axis. Mono-, bi-, and trifunctional combinations are further denoted by green, yellow, and red horizontal bars, respectively. Responses shown correspond to background subtracted results using the CD28/49d control. (B) Summary of functional profile in each group of patients. Each pie chart represents the mean (of all patients within a group) contribution of each effector function to the total response. Green sectors stand for CD8+ cells positive for only one function, yellow sectors stand for bifunctional CD8+ cells, and red sectors stand for trifunctional cells, matching the color code used in panel A. (C) ICS evaluation of ELISPOT assay concordant responses. Here, both peptides used in turn as stimulus are shown aligned to the AVS. The frequency of CD8+ T cells detected using both peptides is shown in each plot.

