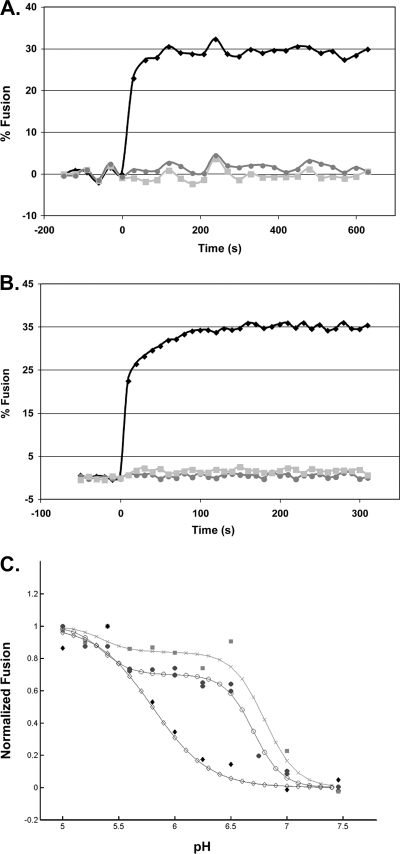
FIG. 2.
Characterization of lipid mixing induced by ASLV and VSV-EnvA. (A and B) Virus from infected cell culture medium was concentrated in 300,000-molecular-weight-cutoff Vivaspin columns and purified by banding on a step gradient of 25% and 60% sucrose (wt/vol). The visible band was collected, pelleted and concentrated by centrifuging through 20% sucrose, and resuspended in 150 μl HM buffer (20 mM HEPES, 20 mM morpholineethanesulfonic acid, 130 mM NaCl [pH 7.5]) overnight on ice at 4°C. To assay lipid mixing, 25 μg ASLV-A (A) or VSV-EnvA (B) was first incubated with sTva (solid black diamonds and solid light grey squares) or without sTva (solid dark grey circles) at pH 7.5 for 30 min at 4°C; liposomes (a 1:1:1:1.5:0.045:0.11 mixture of phosphatidylcholine, PE, sphingomyelin, cholesterol, Rh-PE, and NBD-PE) prepared by extrusion through 50-nm-pore-size filters (6) were added; and the mixture was warmed to 37°C for 15 min to trigger target membrane binding, after which baseline fluorescence at pH 7.5 was recorded for 5 min at 37°C. At time zero, the samples were adjusted to pH 5 and incubated at 37°C, and fluorescence (excitation at 460 nm; emission at 540 nm) was measured for 10 min. Where indicated, R99 was added to a final concentration of 100 μg/ml prior to acidification (solid light grey squares). Maximum possible NBD fluorescence was determined by adding NP-40 to a final concentration of 1% and measuring fluorescence at 37°C for 15 min. Percent fusion was calculated as (FpH − F0)/(FT − F0) × 100, where F0 is the baseline fluorescence (pH 7.5), FpH is the averaged fluorescence at the plateau at pH 5.0, and FT is the fluorescence at an infinite dilution (after disruption of the membranes with 1% NP-40). The data from triplicate samples were averaged. Results of a representative experiment are shown. Each experiment was repeated two or more times. (C) pH dependence of lipid mixing. Samples were treated as for panels A and B except that the pH was adjusted as indicated on the x axis. The results from triplicate samples of individual experiments were averaged, the value at pH 5 was set to 1, and fusion at each individual pH was reported as a fraction of the pH 5 value. The data from two independent ASLV-A experiments (solid dark grey circles), one VSV-EnvA experiment (solid light grey squares), and one influenza X:31 virus (Charles River Laboratories) experiment are plotted. The data for each virus were then fitted by a nonlinear least-squares method using the MatLab curve-fitting toolbox and the equation % fusion = c{1 − tanh[d(pH − pH0)]}, where pH0 is the pH at the inflection point of the curve, c is one-half the height between the initial and the maximal fusion for the curve, and the product(c·d) is the slope of the curve at the inflection point. The data from two independent ASLV experiments (filled circles) and one VSV-EnvA experiment (shaded squares) are plotted. For comparison, the pH dependence of influenza virus X:31 (Charles River Laboratories) was determined (filled diamonds). The fit curves are plotted using the corresponding open circles, X's, and open diamonds, respectively.

