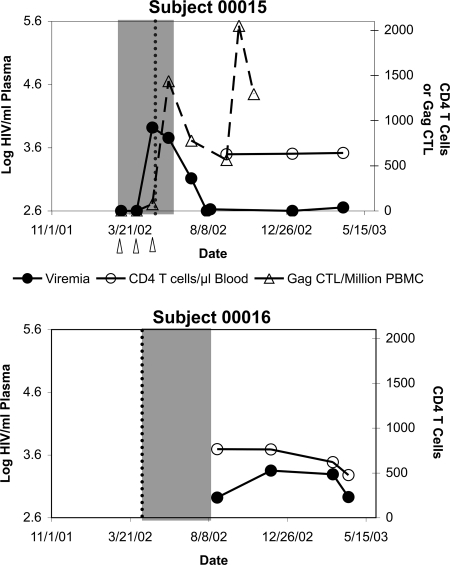
FIG. 1.
HIV-1 infection courses of subjects 00015 and 00016. The levels of plasma viremia and blood CD4+ T-lymphocyte levels are plotted for subject 00015 (top graph) and subject 00016 (bottom graph). For subject 00015, the vaccinations with Gag DNA are indicated by arrowheads, and the total Gag-specific IFN-γ ELISPOT response during the vaccine trial is plotted. The shaded regions indicate the intervals between the last negative and first positive HIV-1 ELISAs. The dotted lines indicate the time of onset of symptoms consistent with primary HIV-1 infection.

