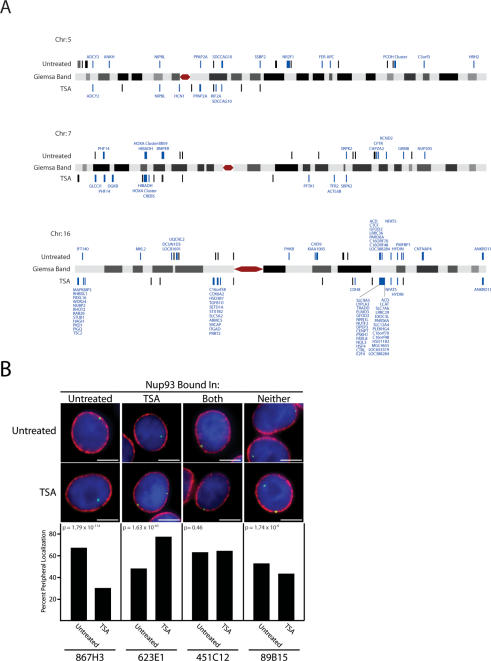
Figure 2.
Nup93 binding map and subnuclear localization of associated genomic regions. (A) Nup93-binding sites identified by ChIP–chip are plotted on schematic representations of chromosomes 5, 7, and 16. Nup93-binding sites are denoted by black bars above or below each chromosome for untreated and TSA-treated cells, respectively. Nup93-binding sites directly overlapping coding regions are labeled blue with the associated gene displayed. Chromosomes are not to scale. (B) FISH analysis of Nup93 targets. Four genomic loci were visually mapped in untreated and TSA-treated HeLa S3 cells. From left to right, these loci interact with Nup93 in untreated cells, TSA-treated cells, both conditions, and neither condition. The top images are examples from untreated cells, while the bottom row are examples from TSA-treated cells. In each image, the FISH signal is green; DNA stained with DAPI is blue; and lamin B, a marker of the nuclear periphery, is red. The bar graphs report percent peripheral localization of each locus in untreated and TSA-treated cells. P-values comparing the difference in percent peripheral localization for each locus were calculated using the χ2 test. BAC probes used to study each genomic region are identified at the bottom of each column. Bars, 5 μm.

