Figure 5.
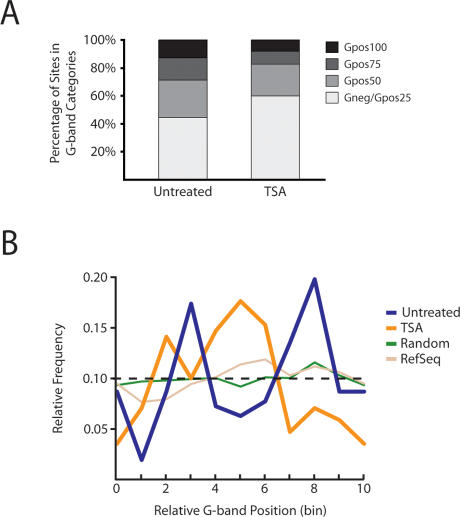
Distribution of Nup93-binding sites within G bands. (A) Nup93 is enriched within Gpos50 bands and depleted in Gneg/Gpos25 bands in untreated conditions when compared with chip5 (P = 1.4 × 10⁻³²; χ2). However, a similar comparison with chip5 distributions shows that TSA-treated Nup93-binding sites are enriched within Gneg/Gpos25 bands and depleted within Gpos75 and Gpos100 bands (P = 4.6 × 10⁻³³; χ2). P-values were calculated by comparing the observed G-band distribution to chip5 G-band distributions using the χ2 test. (B) Binding distribution across G bands. All G bands were normalized by dividing each into 10 equal sections (bins). We assigned each Nup93 site a bin (0–9) based on its relative position between its nearest G-band boundaries. Each bin shown represents the relative position of several Nup93-binding sites (between 10 and 40 sites per bin). Intervals from randomized data sets were uniformly distributed across G bands, which reflected the probe distribution of chip5. Refseq genes failed to show significant positional enrichments (P = 0.97; χ2). However, both untreated and TSA-treated Nup93-binding sites were enriched in specific regions as shown by the peaks in blue and orange, respectively (P = 3.1 × 10⁻⁵ and P = 2.1 × 10⁻⁶, respectively; χ2). Furthermore, untreated and TSA-treated sites were positioned nonrandomly relative to each other, with significant TSA enrichment between two peaks of untreated enrichment (P = 5.4 × 10⁻²³; χ2).

