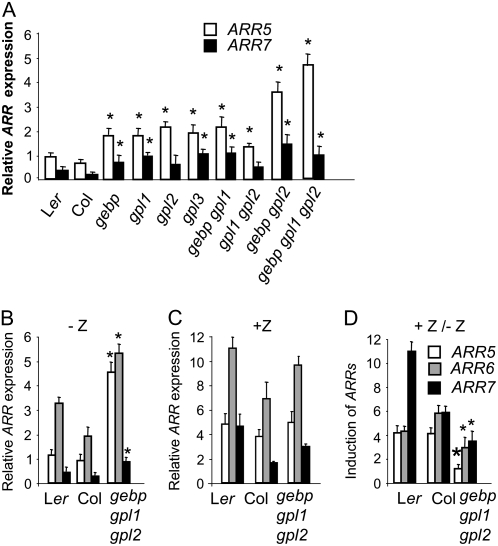
Figure 8.
Transcript levels of ARR cytokinin response genes in gebp/gpl mutants. RT-PCR experiments from whole rosettes were performed in exponential amplification conditions and average integrated density ratios of ARR/Actin8 signals were determined (see “Materials and Methods”). A, Relative expression levels of ARR5 and ARR7 in wild types and single, double, and triple mutants in the absence of cytokinin. B to D, Relative expression levels of ARR5, ARR6, and ARR7 in wild types and triple mutants. Plants were grown in the absence (B) or presence (1 h) of exogenous trans-zeatin (C) and the fold inductions are shown (D). Bars in B and C are like indicated in D. Results in B were confirmed using real-time RT-PCR for ARR5. Asterisks represent significant changes to wild-type controls using the ANOVA test. Results shown are pooled from three independent experiments.

