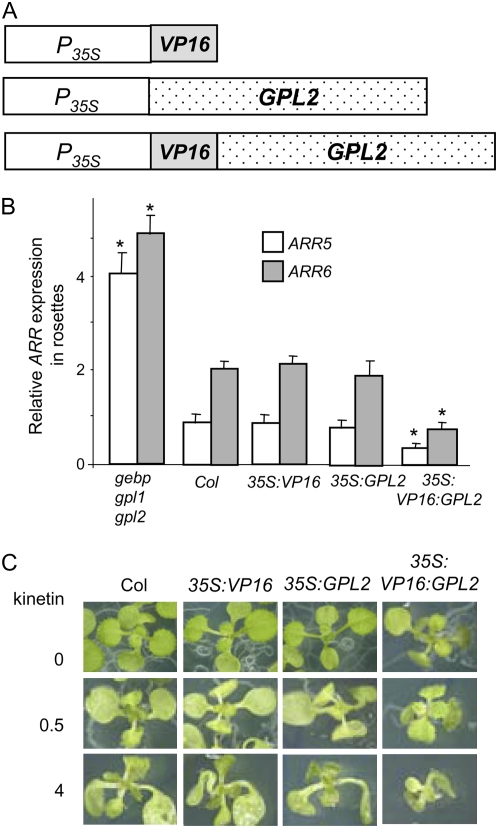
Figure 9.
Transcript levels of ARR cytokinin response genes in rosettes and cytokinin sensitivity assay in 35S:VP16:GPL2 plants. A, Schematic representation of constructs used. 35S promoter (P35S), VP16 AD (VP16), and GPL2 cDNA (GPL2) are represented. B, RT-PCR experiments were performed and quantified as in Figure 8. Asterisks represent significant changes to wild-type control using the ANOVA test. The experiment was done at least three times with consistent results and results were confirmed by real-time RT-PCR for ARR5. C, Growth inhibition by exogenous cytokinins. Wild-type and transgenic lines were grown on MS plates supplemented with the indicated concentrations of kinetin (μg mL−1) for 14 d. Several transgenic lines were tested and gave the same results. [See online article for color version of this figure.]

