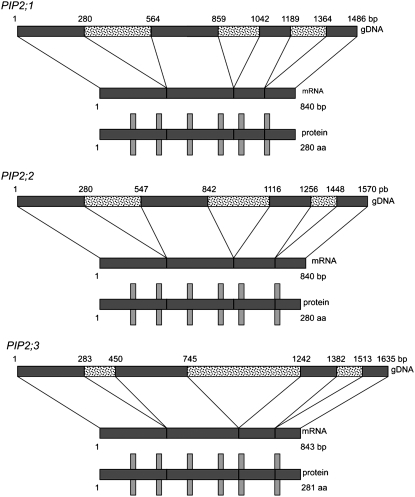
Figure 1.
The putative P. patens PIP2 genes PIP2;1, PIP2;2, and PIP2;3. Schematic diagrams of the PIP2;1, PIP2;2, and PIP2;3 gene structures. The numbers on the genes correspond to the first and last bases of exons (dark boxes). The light boxes indicate introns. Vertical bars and boxes indicate the position of the splicing sites and transmembrane domains within the proteins.

