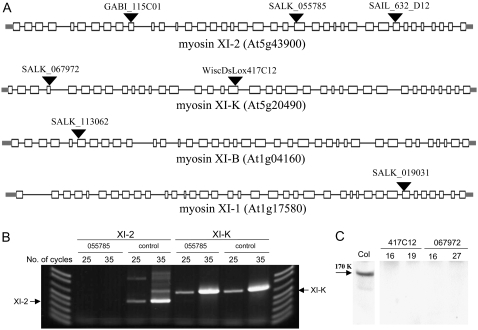
Figure 1.
A, Diagrams of the four Arabidopsis myosin class XI genes with the positions of the T-DNA insertions. White boxes represent exons, black lines represent introns, and gray bars correspond to the 5′ and 3′ untranslated regions. Designations of each line are shown above the corresponding T-DNA insertion sites (black triangles). Sizes of exons and introns are drawn to scale using Gene Structure Display Server (http://gsds.cbi.pku.edu.cn). The diagram corresponding to the gene At5g20490 (myosin XI-K) was modified to accommodate corrections in the exon structure (Ojangu et al., 2007). B, Semiquantitative RT-PCR analysis of the insertion line SALK_055785 in which the myosin XI-2 gene was inactivated. Primers complementary to sites flanking the insertion site in the myosin XI-2 mRNA (lines under XI-2 in the image) or complementary to two regions within the myosin XI-K mRNA (lines under XI-K) were used. In the control, the RNA used for analysis was isolated from the parental Columbia line. The expected position of the DNA amplification products for each mRNA is shown by an arrow. C, Immunoblot analysis of the protein extracts from the control (Col in the image) and myosin XI-K knockout plants using specific polyclonal antibody. Samples from two plants for each line are shown.

