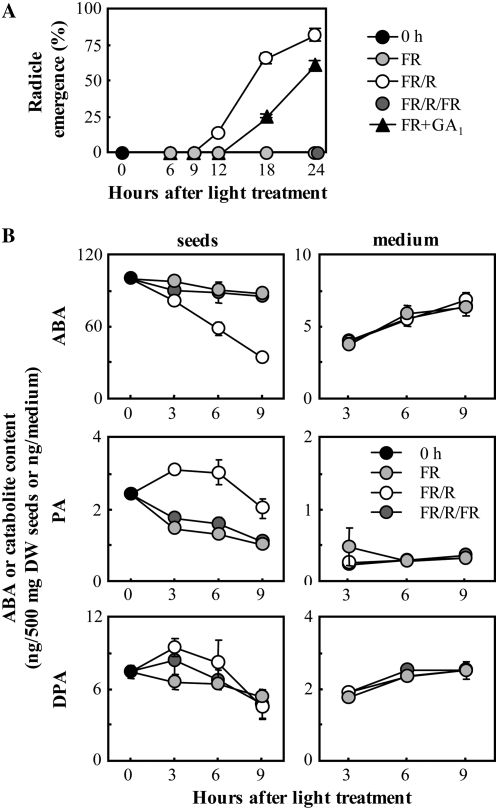
Figure 4.
Quantification of endogenous ABA, PA, and DPA levels during incubation under different light conditions. A, Time course of germination of lettuce seeds under different conditions. 0 h indicates seeds imbibed for 3 h in the dark (just before light treatment). FR+GA1 indicates seeds treated with FR and 1 mm GA1. Experiments were performed in triplicate, and averages are shown with ses. B, The endogenous levels of ABA, PA, and DPA were analyzed by LC-MS/MS. DW, Dry weight. Experiments were performed in duplicate and averages are shown with ses.

