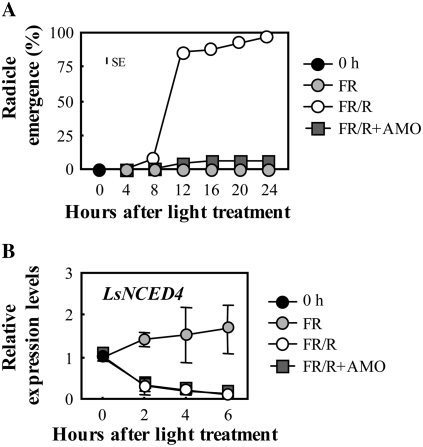
Figure 6.
Changes in transcript levels of LsNCED4 during incubation with GA biosynthetic inhibitor. A, Time course of germination of lettuce seeds under different conditions. 0 h indicates seeds imbibed for 3 h in the dark (just before light treatment). Experiments were performed in triplicate and averages are shown with ses. The vertical bars represent the maximum size of the se bar within the figure. B, Expression levels of LsNCED4 in the seeds incubated in medium containing 50 mm AMO-1618. The expression levels of these genes were analyzed by QRT-PCR as described in the text. The results were normalized to the expression of 18S rRNA (internal control), and then the expression level at 0 h was set to 1. Two independent experiments were performed, and averages are shown with ses.

