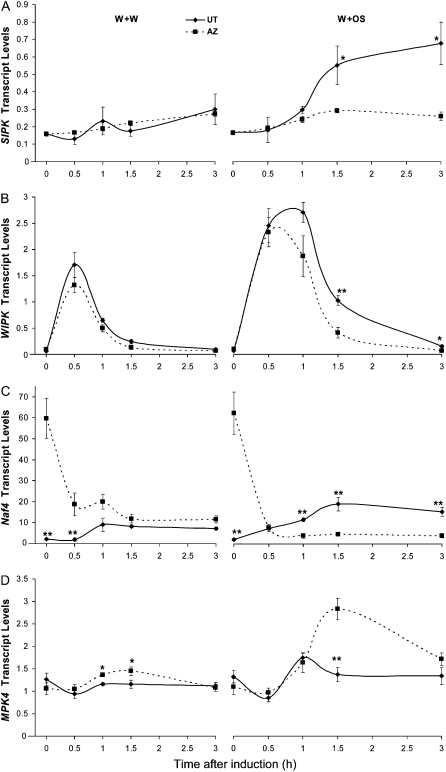
Figure 3.
MAPK genes in N. attenuata UT and AZ accessions have different levels of transcript accumulation. N. attenuata UT and AZ plants were grown under identical conditions. Leaves at +1 position were wounded with a pattern wheel; 20 μL of either W+W or W+OS was applied to the wounds. Individual leaves from five replicate plants were harvested at the indicated times after elicitation. The mean (± se) expression levels of SIPK (A), WIPK (B), Naf4 (C), and MPK4 (D) were measured with qRT-PCR. Asterisks represent significantly different transcript levels between the UT and AZ accessions at the indicated times (unpaired t test; *, P < 0.05; **, P < 0.01; ***, P < 0.001; n = 5).

