Figure 5.
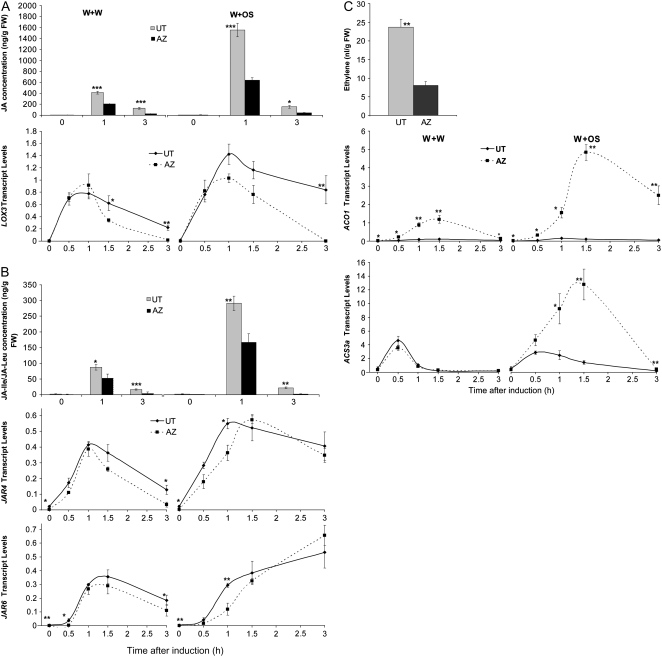
N. attenuata UT and AZ accessions have different levels of wound- and OS-elicited phytohormones. N. attenuata UT and AZ plants were grown under identical conditions. Rosette-stage leaves (+1 position) were wounded with a pattern wheel; 20 μL of either W+W or W+OS was applied to the wounds. A, Mean (± se) JA concentrations in leaves harvested at indicated times were measured with HPLC-MS/MS (top); the mean (± se) transcript levels of LOX3 were measured with qRT-PCR (bottom). B, Mean (± se) JA-Ile/JA-Leu concentrations in leaves harvested at indicated times were measured with HPLC-MS/MS (top); the mean (± se) transcript levels of JAR4, JAR6 were measured with qRT-PCR (middle and bottom, respectively). C, Mean (± se) ET accumulated (top) from treated leaves enclosed in 250-mL flasks and measured after 5 h with a photoacoustic laser spectrometer (n = 3). The mean (± se) transcript levels of ACO1 and ACS3a in leaves harvested at indicated times were measured with qRT-PCR (middle and bottom, respectively). Asterisks represent significantly different transcript levels between the UT and AZ accessions at the indicated times (unpaired t test; *, P < 0.05; **, P < 0.01; ***, P < 0.001; n = 5).

