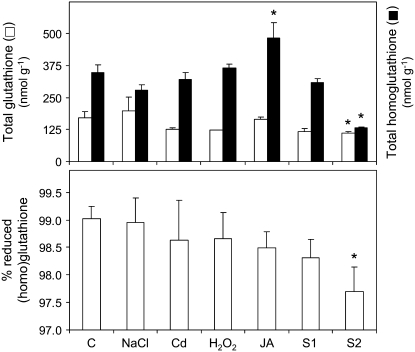
Figure 6.
Total (homo)glutathione contents and percentage of (h)GSH in nodules exposed to stress and during senescence. The (homo)glutathione contents are expressed per gram of fresh weight. Values are means ± se of five to six samples from at least three series of plants grown independently. Asterisks denote significant differences from control nodules based on the lsd test (P < 0.05).

