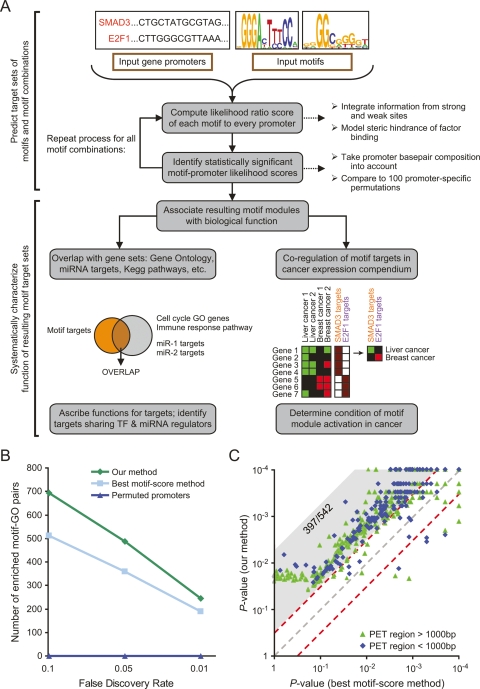
Figure 1.
Overview of our approach and comparison to other methods. (A) Flowchart of our motif functional characterization pipeline. (B) Comparison of the number of significant enrichments between gene sets from Gene Ontology (GO) (Ashburner et al. 2000) and motif modules defined using our approach, GO and an alternative approach based on best motif occurrences, or GO and our approach applied to permuted promoters. For each particular FDR threshold f, the comparison shows the number of GO-motif target set pairs with FDR < f. (C) Comparison of the ability of our method (Y-axis) and best motif occurrences method (X-axis) to predict TP53 binding to 542 sequences experimentally measured to be strongly bound to TP53 by genome-wide chromatin immunoprecipitation followed by sequencing of paired end ditags (PET) (Wei et al. 2006). For each experimentally identified PET region, shown is the predicted binding P-value of each method, determined by comparing the likelihood score of the original region to that obtained in 10,000 regions randomly selected from the human genome. PET regions are separated into two types by their length (green and blue). Of the 542 PET regions, 397 have a fivefold lower P-value in our method (gray shaded area above diagonal), compared with nine with a fivefold lower P-value in the score-based method.

