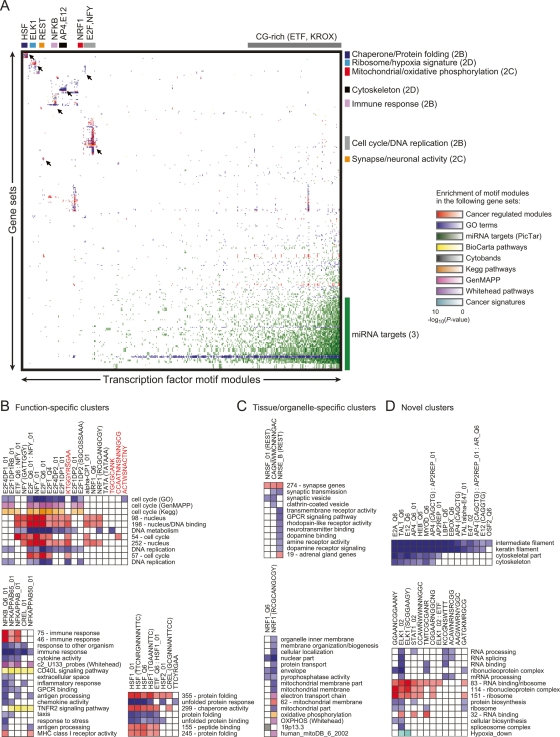
Figure 2.
Functional analysis of motif modules. (A) Global view of specific transcription-factor motifs that are enriched in gene sets (by hypergeometric P-value). Different types of gene sets are distinguished by color, and their intensity corresponds to the significance of the motif module enrichment. Unsupervised clustering was applied to the resulting matrix. Several clusters are shown in detail (indicated by arrows), with the figure location in parentheses. (B) Detailed image of motif module clusters with function-specific enrichment. Novel conserved motif modules that we experimentally validated are highlighted in red. Notations following some transcription-factor names (ex. Q6_01) are identifiers for variants of the motifs according to TRANSFAC. Stand-alone sequences or sequences in parentheses following a transcription-factor name represent consensus binding motifs from ref. (Xie et al. 2005) (key for combination of nucleotides: Y = C or T; R = A or G; W = A or T; S = C or G; K = T or G; M = C or A; N = unknown). Individual motifs of motif combinations are separated by a colon. (C) Detailed image of tissue/organelle-specific enrichments. (D) Detailed image of novel enrichments.

