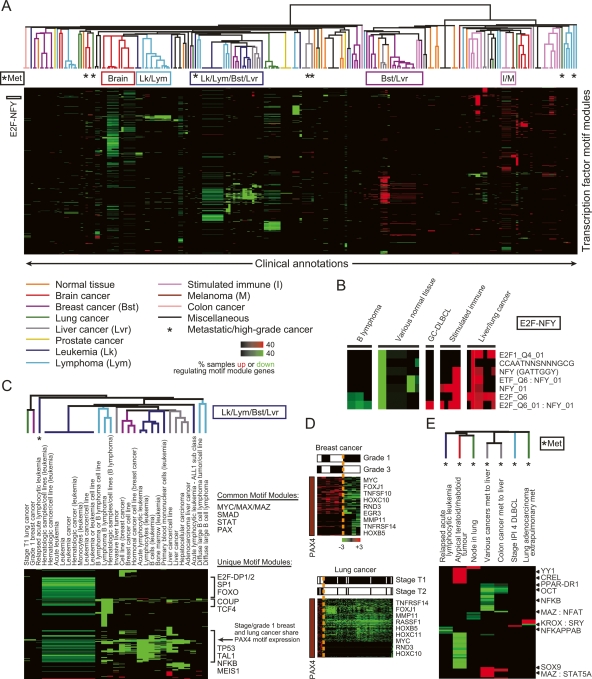
Figure 4.
Global view of cis-regulation in cancer using motif modules. (A) Clinical annotations organized by their associated activated and deactivated motif modules. We used the “module map” method (Segal et al. 2004) on a compendium of 1975 arrays spanning 22 different tumor types. We found arrays in which the genes of each motif module were coordinately induced or repressed (P < 0.05). We then tested the enrichment of these coregulated arrays of each motif module in clinical annotations of the arrays (Segal et al. 2004) (P < 0.05, corrected for multiple hypothesis testing using FDR), and applied unsupervised hierarchical clustering to group together clinical annotations that show enrichments for the same motif modules. Intensity of each enrichment corresponds to the percentage of microarray samples that have motif module target genes significantly induced (up) or repressed (down). The colors of the branch arms represent specific groups of clinical annotations (the specific tissues listed correspond to the tissue origin of the cancer). (*) Groups of metastatic/high-grade cancers. Locations of clusters analyzed in detail are shown at the top and left of the figure. (B) Clinical annotation enrichment of the array signature of E2F and NFY-containing motif modules (E2F-NFY). (C) Motif modules enriched in the leukemia/lymphoma/breast/liver (Lk/Lym/Bst/Lvr) cluster. (D) Shown are PAX4 motif module genes noted in C that are significantly induced or repressed in the indicated grade/stage of breast/lung cancer, respectively. PAX4 target gene induction is enriched in the higher grade/stage tumors (P < 0.05, χ2 test). (E) Motif modules enriched in metastatic/high-grade tumors (*Met) of different histologic origins.

