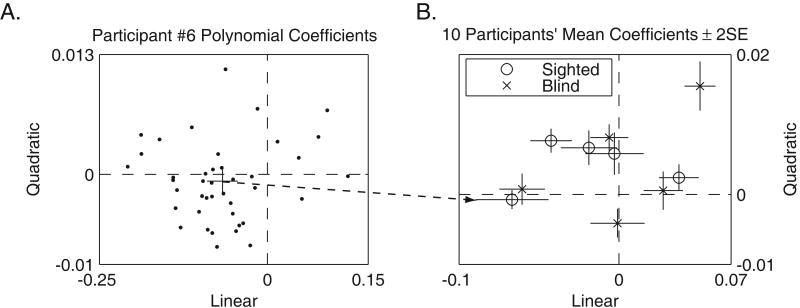
Figure 4.
Quadratic and Linear Contributions to Walking Trials. Figure 4A shows the distribution of linear and quadratic coefficients over 41 trials for participant P6. Each data point represents a polynomial fit for a single trajectory. The crosshair in the middle of Figure 4A shows the mean ± 2 standard errors. Figure 4B shows the mean polynomial coefficients for all 10 participants.

