Abstract
Osteomalacia is characterized by hypomineralization of the bone associated with increased water content. In this work we evaluate the hypotheses that 1) 3D solid-state magnetic resonance imaging (MRI) of 31P (SSI-PH) and 1H (SSI-WATER) of cortical bone can quantify the key characteristics of osteomalacia induced by low-phosphate diet; 2) return to normophosphatemic diet (NO) results in recovery of these indices to normal levels. Twenty female five-week old rabbits were divided into four groups. Five animals were fed a normal diet for 8 weeks (NOI); five a hypophosphatemic diet (0.09%) for the same period to induce osteomalacia (HYI). To examine the effect of recovery from hypophosphatemia additional five animals received a hypophosphatemic diet for 8 weeks, after which they were returned to normal diet for 6 weeks (HYII). Finally, five animals received a normal diet for the entire 14 weeks (NOII). The NOI and HYI animals were sacrificed after 8 weeks, the NOII and HYII groups after 14 weeks. Cortical bone was extracted from the left and right tibiae of all the animals. Water content was measured by SSI-WATER and by a previously reported spectroscopic proton-deuteron nuclear magnetic resonance (NMR) exchange technique (NMR-WATER), phosphorus content by SSI-PH. All MRI and NMR experiments were performed on a 9.4 Tesla spectroscopy/micro-imaging system. Degree of mineralization of bone (DMB) was measured by μ-CT and elastic-modulus and ultimate-strength by 3-point bending.
The following parameters were lower in the hypophosphatemic group: phosphorus content measured by SSI-PH (9.5±0.4 versus 11.1±0.3 wt %, p<0.0001), ash content (63.9±1.7 versus 65.4 ±1.1 wt %, p=0.05), ultimate-strength, (96.3±16.0 versus 130.7±6.4 N/mm2, p=0.001), and DMB (1115 ± 28 versus 1176±24 mg/cm3, p=0.003); SSI-WATER: 16.1±1.5 versus 14.4±1.1 wt%, p=0.04; NMR-WATER: 19.0±0.6 versus 17.4±1.2 wt%, p=0.01. Return to a normophosphatemic diet reduced or eliminated these differences (SSI-PH: 9.5±0.9 versus 10.6±0.8 wt %, p= 0.04; DMB: 1124±31 versus 1137±10 mg/cm3, p=0.2; US: 95.6±18.6 versus 103.9±7.5 N/mm2, p=0.2; SSI-WATER: SSI-WATER: 12.4±0.6 versus 12.2±0.3 wt%, p=0.3) indicating recovery of the mineral density close to normal levels. Phosphorus content measured by SSI-PH was significantly correlated with DMB measured by μ-CT (r2=0.47, p=0.001) as well as with ultimate-strength (r2=0.54, p=0.0004). The results show that the methods presented have potential for in situ assessment of mineralization and water, both critical to the bone’s mechanical behavior.
Keywords: Osteomalacia, DMB, magnetic resonance imaging, 1H, 31P
Introduction
Osteomalacia is a disease characterized by decreased bone mineral density caused by inadequate supply of vitamin D, calcium or phosphorus resulting from deficits in nutrition, renal failure or interference of certain drugs with calcium and vitamin D metabolism [1]. During mineralization of bone the influx of mineral ions into osteoid is paralleled by a concomitant loss of water [2] under retention of the entire bone volume [3]. Bone water is known to occur in various phases. The fraction of water filling the spaces of the haversian and lacuno-canalicular system is relatively loosely bound unlike the tightly bound water interacting with the polar head groups of the collagen scaffold via hydrogen bonds. Water associated with the mineral phase is even more tightly bound and cannot be displaced [4]. The water occupying the spaces of the lacuno-canalicular system serves as a medium for transport of nutrients and ions from the bone’s vascular system to the osteocytes and waste products in reverse direction [5]. Another function of bone water is to provide the damping resistive forces accompanying the stress-induced deformations in response to mechanical loading [6].
In osteomalacia mineral in adult bone is increasingly replaced by water thus resulting in decreased degree of mineralization of the bone (DMB) and reduced stiffness [7]. Hypomineralization leads to impaired mechanical competence of the skeleton and therefore increased fracture risk in adults. Thus, osteomalacia is characterized by a generally normal amount of undermineralized bone, in contrast to reduced amount of normally mineralized bone as in osteoporosis.
The common diagnostic modalities relying on a measurement of apparent density (dual-energy X-ray absorptiometry (DXA) and X-ray computed tomography (CT)), cannot distinguish between osteoporosis and osteomalacia. True bone mineral density has been quantified by microradiography [8] or back-scattered electron imaging [9]. At very high resolution (thereby preventing partial volume averaging involving pores) CT can, in principle, measure true mineralization density as has been shown in specimen work [10, 11]. Recent work by Wu et al [12, 13] involving both solid-state 31P and 1H MRI showed that phosphorus content and matrix volume can be quantified, therefore potentially allowing measurement of DMB. Recent work from this laboratory on osteoid water measurements in bone by 1H NMR spectroscopy in conjunction with D2O isotope exchange [7, 14], and 3D 31P solid-state MRI of phosphorus [15] suggest these methods to be able to distinguish hypomineralized from normal bone. The purpose of the present work was to 1) explore the potential of both solid-state 1H and 31P MR imaging of bone to quantify bone water and phosphorus content in a rabbit model of osteomalacia and thereby differentiate osteomalacic bone (induced by a diet low in phosphorus) from normal bone and 2) to investigate the extent to which hypomineralization is reversible through dietary means.
The spin-spin dipolar coupling in the absence of motional narrowing leads to extremely short transverse relaxation times (T2 and T2*) which are on the order of 250 μs and 100 μs for water protons and phosphorus in bone, respectively [15]. Thus, an image with adequate signal-to-noise ratio (SNR) can be obtained only by sampling the center of k-space at a time after excitation that is short relative to T2. Therefore, conventional spin-warp spin-echo imaging techniques [16] yield very little or no signal from bone water and mineral constituents. Solid-state imaging techniques such as single-point imaging [17] and its variants [18, 19], while capable of capturing the short T2 signals from bone [19], are rather inefficient as far as the scan times are concerned. Recently, solid-state imaging techniques based on radial acquisition schemes have been used to study bone mineral [20-22]. Toward the objectives of the present work, we implemented a three-dimensional radial projection imaging sequence [23], also described in previous work from this laboratory [15] to quantify bone mineral phosphorus and bone water. Bone water measurements were compared with those obtained by D2O isotope exchange NMR [14] and gravimetry, those of 31P MRI by quantitative micro-computed tomography (μ-CT) and ashing. The effect of hypomineralization on the bone’s mechanical properties was assessed by mechanical testing.
Materials and Methods
Animal model and specimen preparation
The rabbit model of osteomalacia chosen has been described previously [7]. The rationale for the choice of the model is the similarity of this species’ cortical bone Haversian system with that present in humans. The study was done in two phases. Phase I comprised 10 rabbits. Five to six week-old female, New Zealand white rabbits (N = 10) were obtained from ACE Animals Inc, Boyertown, PA. After one week of normal diet and water ad libitum the rabbits were divided into two groups, hypophosphatemic (HYI) and normophosphatemic (NOI) (N = 5 each). During the following eight weeks the HYI group was fed a low-phosphorus diet (0.09% phosphorus) of 125 gm/day to induce osteomalacia. The NOI group received the same diet supplemented with sodium phosphate to normal levels (0.5% phosphorus) and water ad libitum. The custom-made diets (Purina Test Diets from Animal specialties and provision, Hazeltown, PA) are adequate to cover the nutritional requirements of growing rabbits. During the eight-week period food consumption and body weight were monitored weekly. At the end of this period, the animals were sedated with 200/20 mg/ml of ketamine/xylazine solution (given intra-muscularly) and euthanized with 2-3 ml of euthanasia-6 solution administered intravenously. Whole tibiae and femora were extracted from the animals after cleaning the bones of external soft tissue. The specimens were then wrapped in aluminum foil and kept frozen until the time of experiments. Before the experiments all specimens were cleaned of the remaining soft tissue and bone marrow was removed using a high-pressure water jet. Tubular pieces (1.5 ∼ 2 cm in length) from the right tibial shaft were sectioned to measure mineral phosphorus and matrix water, with the same specimens being used for both types of measurements. The solid-state radial projection imaging (here referred to as SSI-PH and SSI-WATER) is described in the following section. In order to validate the results from imaging, water and DMB were also measured with established methods. Three plate-like cortical bone specimens with dimensions 10 mm × 4 mm × cortical thickness were cut from the posterior, medial and lateral sides of the same tibial shaft. The posterior specimens were used to measure osteoid water by 1H NMR spectroscopy using deuterium isotope exchange and the lateral and medial specimens to estimate water and ash content by gravimetric analysis. Specimens of approximately 4 cm length centered at the bone’s mid-point were then cut from the left tibia and femur for assessing DMB using high-resolution μ-CT imaging. Finally, the latter specimens were tested mechanically by three-point bending. All specimens were soaked in saline overnight to allow rehydration (to recover water that might have been lost during specimen preparation).
Phase II comprised 10 rabbits and was aimed to investigate the recovery of the animals from osteomalacia after returning them to a normophosphatemic diet. Initially, five rabbits were fed a hypophosphatemic diet for 8 weeks as in Phase I to induce osteomalacia (HYII). This regimen was followed by a normal diet for 6 weeks and the results compared with those from 5 rabbits that had been fed a normal diet for all 14 weeks (NOII). The animals were sacrificed after 14 weeks and cortical bone extracted as in Phase I. The phosphorus and water content was again quantified as described above using solid-state MRI and compared against the material properties from three-point bending as well as DMB from μ-CT. The timeline for the different groups and procedures is summarized in Figure 1.
Figure 1.

Timeline showing the preparation and execution of the different phases in the study. HYI and NOI groups were sacrificed after 8 weeks. HYII was switched to normal diet after 8 weeks and both HYII and the control group NOII) were sacrificed after 14 weeks.
The research was performed in compliance with federal regulations and the guidelines of the Institution’s Animal Care and Use Committee (IACUC).
Solid-state Imaging
The solid-state imaging sequence described in greater detail in [15] was implemented on a vertical-bore 9.4 T micro-imaging system (Bruker Avance DMX-400, Bruker Instruments, Billerica, Massachusetts). The frequencies of operation were 400 MHz for proton and 162 MHz for phosphorus, respectively. The system was equipped with gradients of 100 G/cm maximum strength and ramp time of 100 μs. The basic imaging sequence (Figure 2) consists of a nonselective pulse, followed 8 μs later by free-induction decay (FID) sampling in the presence of three projection readout gradients in order to minimize the acquisition delay after excitation and hence maximize the signal from the bone. The gradients were simultaneously modulated so that the k-space vector mapped the surface of 65 coaxial cones in equally spaced angular increments [23], thus enabling uniform coverage of points on the surface of a sphere. FID collection necessitates sampling during the gradient ramping period in order to map the center of k-space and this nonuniform sampling of the initial few points was compensated by regridding during reconstruction, which was implemented using Greengard’s fast numerical algorithm for the nonuniform fast Fourier transform [24]. The weight assigned to each k-space point was chosen proportional to the square of the k-space radius, while the points on the ramp were adjusted by a factor proportional to the local sampling interval Δk. Though the basic acquisition was similar for both the proton and phosphorus, the long T1s of bone phosphorus required a preparation stage before the radial acquisition for 31P imaging in order to put the spin system into steady state. The details of the acquisition parameters for both nuclei along and the steady state preparation stage for 31P imaging chosen are given below. The 3D bone volume reconstruction and rendering were done using Image J, an image processing and analysis program developed at the National Institutes of Health (NIH).
Figure 2.
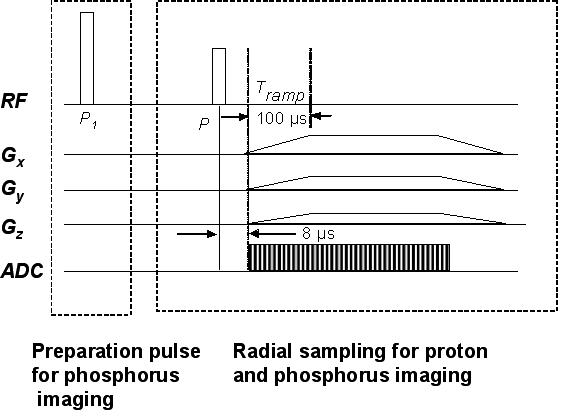
3D radial projection imaging sequence using ramp sampling for phosphorus and proton imaging designed for uniform mapping of k-space. The initial preparatory pulse, P1 (60°), played out only once, was used for phosphorus with long T1 in order to prepare the magnetization into the steady state.
1H solid state MRI (SSI-WATER)
One hundred and twenty-eight complex points at 5 μs dwell time were sampled for each of the 2626 views. The imaging parameters used for bone water imaging were: flip angle, α ∼ 90°; TR=1 s; field of view, FOV=2.5×2.5×2.5 cm3; number of averages per view, Nav=1 with a sampling frequency bandwidth, BW = 200 kHz. These scan parameters yielded a total acquisition time of ∼ 44 min. The bone specimens were co-imaged with a reference capillary (1 mM gadolinium-DTPA doped water containing ∼ 80% v/v D2O) for quantification of water. The T1 relaxation times needed for quantification for bone and reference solution were obtained with an inversion recovery pulse sequence [15]. The mean T1 of the animals pertaining to phase I was 457±13 ms, that for the phase II animals 527±7 ms, T1 of the reference solution was 980 ms.
The images were reconstructed by regridding the k-space data onto a matrix 137 × 137 × 137 (after taking into account the number of points on the linear gradient ramp) yielding a nominal isotropic resolution of 183 × 183 × 183 μm3. The true resolution, limited by the line width (∼ 1400 Hz) that governs the point-spread function, was estimated as 0.18 mm, essentially matching that predicted by the reconstruction. From the mean signal intensity Ibone (from the center 20 slices) in a bone pixel the water concentration in g/cm3 was computed using the mean pixel intensity of the reference capillary, I ref as follows:
| (1) |
where xH2O = 0.28 is the volume fraction of H2O in the reference capillary. The reference capillary was calibrated with a series of samples of varying H2O/D2O isotopic ratio yielding a calibration curve from which the exact volume fraction of water in the reference solution was obtained. Fbone and Fref are the correction factors to account for the differences in T1 of bone water and the reference solution, respectively:
| (2) |
| (3) |
T1bone and T1ref are the T1 relaxation times of the bone and the reference, respectively and α is the radiofrequency pulse flip angle.
To avoid errors from partial volume averaging of the boundary pixels and from point spread function blurring due to short T2, the mean signal intensity of the bone was computed from the intensity histogram after segmenting and thresholding the images to include the pixels with intensities above the mode of the histogram. Water content was subsequently calculated as weight percent from the knowledge of the weight (in grams) and volume (in cm3) of the specimens. Specimen volume was obtained from high-resolution 3D gradient-echo images after their immersion in doped water at a voxel size of 100×160×160 μm3 voxel size. The images were segmented at the midpoint of the bimodal histogram and specimen volume determined as the sum of all bone voxels.
31P solid state MRI (SSI-PH)
In order to optimize the pulse sequence parameters for imaging, T1 of all 20 specimens was measured with an inversion-recovery sequence. As explained previously, the long T1 necessitated an initial preparation pulse (preparation flip angle ∼ 60°) to place the magnetization into its steady state value [15] (Figure 2) followed by uniform radial sampling on a sphere. Sixty-four complex points at 5 μs dwell time were sampled for each of the 2626 views. The scan parameters used were: TR=0.25s; FOV=3×3×3 cm3; number of averages per view, Nav=8, BW = 200 kHz, resulting in a total scan time of 1 hour 40 minutes. The reconstructed images yielded a matrix size of 108 × 108 × 108 resulting for a nominal voxel size of 277 × 277 × 277 μm3. However, the greater line width of the phosphorus signal (∼ 3.3 kHz) limits the actual resolution to 0.5 mm. The bone specimens were co-imaged with a capillary consisting of 2.5 M K2HPO4, used as a reference for phosphorus quantification. The phosphorus concentration in g/cm3 was computed as weight percent from the measured average pixel intensities in the specimen and reference capillary after correcting for the saturation due to the long T1 of phosphorus in bone. The mean T1 of phosphorus for the Phase I animals was significantly shorter in the osteomalacic than in the control bone (47.2±3.5 vs. 54.1±2.7 s), and similarly for Phase II (61.0±2.6 versus 67.3±3.6 s). T1 of the reference solution was 4.6 s.
Bone Water Measurements by Exchange NMR
Using an approach described in an earlier paper from the authors’ laboratory [14], the amount of water exchanged from the bone was estimated by means of (light) water (H2O) - deuterium oxide (D2O) exchange NMR. After immersing the bone (posterior specimen) in D2O, the ratio of the water peak integral to the ratio of the reference capillary was obtained at regular intervals of time. The difference between the ratios obtained after the water had attained an equilibrium value and the initial value (immediately following immersion) yields the total water exchanged from the bone into D2O. This value, in conjunction with a calibration curve obtained with the reference capillary containing mixtures of H2O/D2O of varying volume fraction, gives an estimate of the osteoid water exchanged from the bone.
Gravimetric Analysis
The gravimetric measurements, using standard procedures, were performed on two cortical bone specimens from each animal (lateral and medial sites) of approximately the same size as the posterior specimen used for water measurements. After measuring wet weight, the specimens were dried at 100° C for 48 hrs so as to expel collagen-bound and pore water. Finally, the specimens were ashed in a furnace for 24 hrs at 600° C. The amount of water in the bone was determined as the difference between wet and dry weights, while mineral weight corresponds to the specimen’s ash weight.
Micro-Computed Tomography (μ-CT)
The purpose of the micro-computed tomography (μ-CT) measurements was twofold: (a) to quantify DMB in the specimens with the help of various reference concentrations of K2HPO4 for comparison with MRI-derived mineral concentration 2) to obtain high-resolution 3D images of the bone from which the dimensions, cross-sectional area and moment of inertia could be derived in order to evaluate, elastic-modulus and ultimate-strength using three-point bending, the details of which are given in [15]. The images were acquired on an MS-8 instrument (General Electric Medical Systems, formerly EVS Corporation, London, Ontario, Canada). In short, 721 views, each covering 1024 × 1024 pixels were collected at 0.5° increments corresponding to one full rotation of the left tibia. The scan time was 3.5 hrs for 4 averages per view. Images were obtained in the presence of different concentrations of dipotassium hydrogen phosphate (K2HPO4) varying from 100mg/cm3 to 1200 mg/cm3 with a reconstruction voxel size of 16×16×32 μm3. The calibration curve obtained with these known densities was subsequently used in conjunction with the bone images (segmented to include pixel values above three times the background value) to obtain the DMB of the specimens.
The cross-sectional moment of inertia, needed for the estimation of the mechanical parameters, was obtained from these images as where yi is the distance from the ith pixel of area ai to the neutral axis [7]. The neutral axis is perpendicular to the direction of the applied load and its vertical location coincides with the center of mass of the section and thus is given as
| (4) |
Biomechanics
The mechanical properties of the bone were assessed on the same tibiae used for assessment of DMB by three-point bending [25] using a protocol described in [7]. Measurements were performed on a material testing machine (Instron Universal, model 8500) while keeping the specimens immersed in saline at 37°C. The load was applied at the center of the anterior surface of the tibia, while the posterior surface was supported on a custom-made anvil with two supports separated by a span of L ∼ 20 mm [25]. The strain rate applied to the specimens was 4.57 mm/min. From the load deformation curves, Pmax, the peak load, Pel, the load at the elastic limit, and Y, the deformation at the elastic limit was determined. From these quantities the elastic modulus and ultimate strength were calculated.
Statistical Analyses
The water content and the mineral content estimated by the different methods described above were examined to evaluate the group differences (within phase I and phase II) by student’s t-tests using JMP (SAS Institute, Cary, NC) statistical package. Associations between material and mechanical constants were examined by linear regression.
Results
The center 20 slices obtained for one of the specimens, along with the respective reference capillaries after reconstruction from SSI-PH and SSI-WATER, are given in Figures 3 a and b. The 3D-rendered bone images obtained for the same specimen with both SSI-PH and SSI-WATER are shown in Figures 3 c and d. Phosphorus content, μ-CT-derived DMB and ultimate strength were all lower in hypophosphatemic animals (p<0.0001 to p=0.003), ash weight fraction was marginally lower (p=0.06). These inter-group differences, along with the respective standard deviations, are given in Figure 4 a. Preliminary data of the bone phosphorus and DMB measurements for Phase I were provided in [15] in which the details of the solid-state MRI technique were published. Phosphorus quantified by SSI-PH was found to be about 15% lower in the HYI relative to the NOI group (p<0.0001) while DMB was lower by about 5% (p=0.003). Ash content was within the values found in literature [7, 26] and was again lower in the hypophosphatemic animals by about 2.4%. Ultimate strength was lower in hypophosphatemic bone by 26% (p=0.001). The data also suggested hypomineralized bone to have reduced elastic modulus though the difference was not statistically significant.
Figure 3.
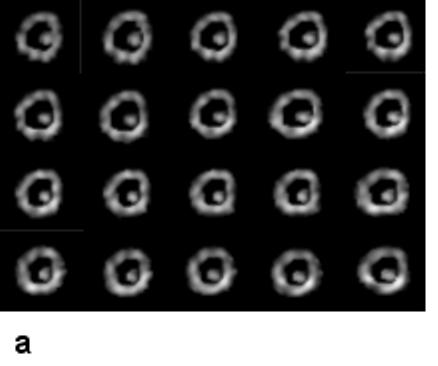
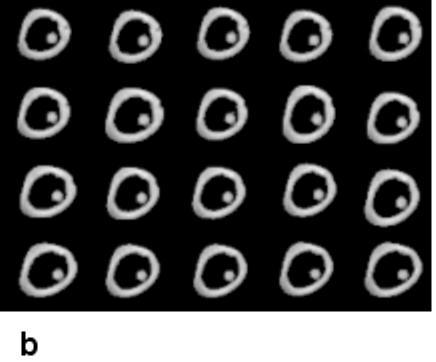
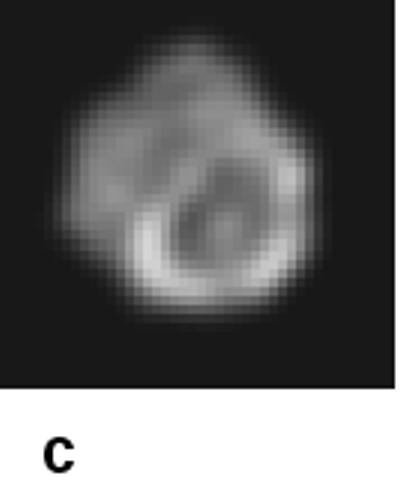
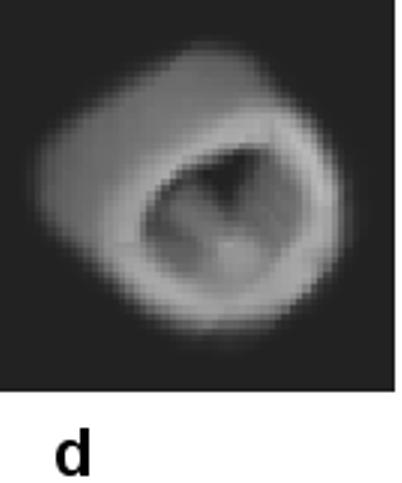
Central 20 slices from the data set of one of the bone specimens, with reference capillaries (in endosteal cavity) used for quantification: a) 31P (SSI-PH); b) water (SSI-WATER). Voxel size: 277×277×277 μm3 (a) and 183×183×183 μm3 (b). Volume rendered images of the same specimen obtained by SSI-PH (c) and SSI-WATER d).
Figure 4 a.
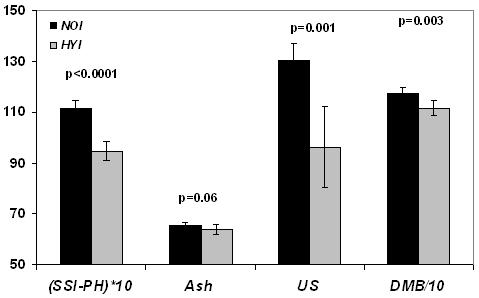
Group differences showing lower measures of bone phosphorus quantified by solid state 31P MRI (SSI-PH) (wt%), ash (wt%), Ultimate strength (US) in N/mm2 and degree of mineralization of bone (DMB) in mg/cm3 in the hypophosphatemic group (HYI) as compared to the same age control group (NOI) in phase I. Bars indicate mean±SD and p represents the statistical significance.
In Phase II it is noted that group differences for DMB and related quantities were decreased suggesting partial recovery from hypophosphatemia. Even though some of the data for the 14-week control group (NOII) still appear to be greater than those in the hypophosphatemic recovery group (HYII), none of the differences were significant (p>0.05) except bone phosphorus (p=0.04, Figure 4b). Table 1 summarizes the mean bone mineral phosphorus, ash, ultimate-strength and elastic modulus, along with the associated standard deviations and the inter-group comparisons within Phase I and Phase II.
Figure 4 b.
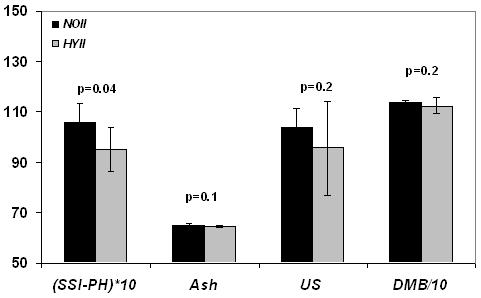
Same measures as in Figure 4a comparing hypophosphatemic (HYII) and control group (NOII) in phase II indicating partial recovery of HYII animals upon return to normophosphatemic diet.
Table 1.
Measures of bone mineral and mechanical properties quantified by different modalities in NOI, HYI, NOII and HYII groups (mean±SD; N=5)
| Group | SSI-PH (wt %) | Ash (wt%) | DMB (mg/cm3) | US (N/mm2) | EM (N/mm2) |
|---|---|---|---|---|---|
| NOI | 11.1±0.3a | 65.4±1.1c | 1176±24b | 130.7±6.4b | 3813±1386c |
| HYI | 9.5±0.4 | 63.9±1.7 | 1115±28 | 96.3±16.0 | 2862±1158 |
| NOII | 10.6±0.8d | 65.1±0.7e | 1137±10e | 103.9±7.5e | 2595±278 |
| HYII | 9.5±0.9 | 64.6±0.7 | 1124±31 | 95.6±18.7 | 2096±499 |
NOI versus HYI (p<0.0001, respectively)
NOI versus HYI (p<0.005, respectively)
NOI versus HYI (p>0.05, respectively)
NOII versus HYII (p<0.05)
NOII versus HYII (p>0.05)
Bone water quantified by the three methods in Phase I was higher in the osteomalacic bone (HYI vs NOI) corroborating the hypothesis that decreased mineral is paralleled by an increase in bone water, as previously established on the basis of deuterium-exchange NMR [7] (Figure 5 a). Water content, measured in situ by solid-state MRI (SSI-WATER) was higher by about 12% in the hypomineralized than in the normal control group (HYI versus NOI, p=0.04). Similarly, water content measured by exchange NMR (NMR-WATER) was higher by 9% in HYI than in NOI (p=0.01). Positive correlations were obtained between the water quantified by solid state MRI and exchange NMR: SSI-WATER (wt %) = 0.66 + 0.8 NMR-WATER (wt %), r2=0.43, p=0.04. Finally, water content quantified by drying appeared to be higher in the HYI group though the difference was not statistically significant (p=0.1).
Figure 5 a.
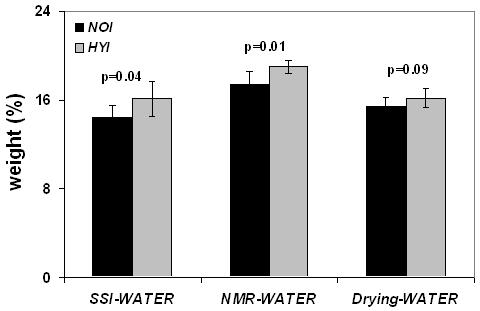
Group differences showing higher water content quantified by solid state 1H MRI (SSI-WATER) (wt%), exchange NMR (NMR-WATER) (wt%) and gravimetry (Drying-WATER) (wt%) in the hypophosphatemic group (HYI) as compared to the same age control group (NOI) in phase I. Bars indicate mean±SD and p represents the statistical significance.
The mean water quantified with the different methods for all four groups including inter-group comparisons are given in Table 2. The data show that the relative increase in mineralization upon return of the animals to a normophosphatemic diet was paralleled by changes in the opposite direction for bone water. The Phase II data indicate the difference in water quantified by solid-state MRI to have decreased from 11% in Phase I to 2% but this residual difference was not significant. Similarly, water quantified by H2O/D2O was not significantly different between HYII and NOII groups (Figure 5b).
Table 2.
Measures of bone water quantified by different modalities in NOI, HYI, NOII and HYII groups (mean ±SD; N=5)
| Group | SSI-WATER (wt %) | NMR-WATER (wt %) | Drying-WATER (wt %) |
|---|---|---|---|
| NOI | 14.4±1.1a | 17.4±1.2a | 15.4±0.8b |
| HYI | 16.1±1.5 | 19.0±0.6 | 16.2±0.9 |
| NOII | 12.2±0.3c | 19.1±0.9c | 16.3±0.6c |
| HYII | 12.4±0.6 | 18.8± 1.3 | 16.0±0.4 |
NOI versus HYI (p<0.05)
NOI versus HYI (p>0.05)
NOII versus HYII (p>0.05)
Figure 5 b.
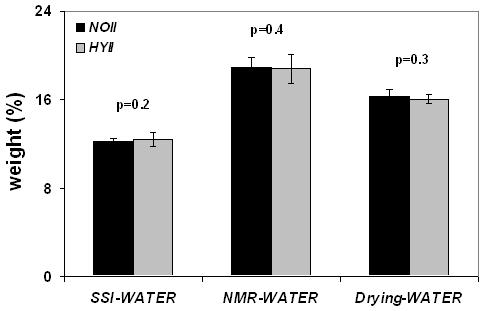
Same measures as in Figure 5a comparing hypophosphatemic (HYII) and control group (NOII) in phase II indicating partial recovery of HYII animals upon return to normophosphatemic diet.
Significant positive correlations were obtained for the pooled data between the phosphorus quantified by SSI-PH and DMB quantified by μ-CT (r2=0.47, p=0.001). Similarly, positive correlations were obtained between phosphorus content and ultimate strength (r2=0.51, p=0.0004. The water measured by exchange NMR (NMR-WATER) was negatively correlated with the elastic modulus (r2=0.26, p=0.03).
Discussion
While the feasibility of both proton and 31P solid-state MRI to quantify matrix constituents and mineral have previously been shown [12, 20, 27] no quantitative studies have so far been reported with either technique to evaluate the effect of intervention in metabolic bone disease. The fundamentals of 31P solid-state imaging as a noninvasive means to detect the changes in bone mineralization resulting from hypomineralization in an animal model of osteomalacia has recently been demonstrated in the authors’ laboratory [15] The aim of the present work was to explore the feasibility of 31P and 1H solid-state imaging to detect the changes in bone mineral and water in experimentally induced osteomalacia and further, to establish the method’s sensitivity to detect the effect of nutrition-induced remineralization.
Previous studies of DMB variations in bone [26, 28] indicated that small variations in this parameter can have significant implications on the bone’s mechanical properties. Vose and Kubala [28] showed that the breaking stress of cortical femoral bone decreased by as much as a factor of three for a mere decrease of 7% in ash content. These observations were later corroborated by Currey [26] who showed that the bone with highest ash content had the largest elastic modulus. The present results of significantly decreased bone phosphorus in the osteomalacic group (Phase I) parallel the reduced ultimate strength characteristic of osteomalacic bone.
In the Phase II study whose purpose was to evaluate whether the adverse effects of a hypophosphatemic diet is reversible by returning the osteomalacic animals to a normophosphatemic diet, our data show that bone phosphorus, DMB as well as the mechanical properties indicate at least partial recovery (all measures except the bone phosphorus yielded no significant difference between the HYII and NOII). The difference in the phosphorus content between the two groups decreased to 10 % (from 14 %), still marginally significant (p=0.04). It is noted that in Phase I this parameter was by far the strongest differentiator of the two groups (p<0.0001) with no overlap. Lastly, it is noted that MRI-derived bone phosphorus does not necessarily parallel CT-determined mineral content since the former specifically measures one specific anionic constituent. Therefore, it is possible that the decrement in calcium concentration is less in that phosphate may be partially substituted with another anion such as carbonate [29]. It is noted further, that our phosphorus weight fractions measured by SS-MRI (10-11%) are in good agreement with those obtained by (destructive) high-resolution NMR spectroscopy [7], an accepted quantitative technique. In contrast, for stoichiometric calcium apatite and the measured ash weight fraction of about 65%, a phosphorus weight fraction of 18% would be predicted.
Our results, in conjunction with the positive correlations obtained with DMB and the bone’s mechanical properties, highlights the potential of solid-state 31P MRI as a new nondestructive means to quantify mineralization constituents in situ and potentially in vivo and hence compositional and nanostructural changes associated with metabolic bone disease.
At first sight, the lower static magnetic field strengths of clinical scanners (1.5 - 3T) would be expected to compromise the achievable signal-to-noise ratio (SNR), and thus resolution, compared to the much higher field at which the present work was conducted (9.4T). However, this may actually not be the case, for the following reasons: The reduced 31P chemical shift anisotropy contribution (which scales linearly with the field), results in reduced line widths at the lower fields thus resulting in increased T2. Wu et al. [27] reported line widths of ∼1600 Hz at 1.5T which are approximately half the line width obtained in the present case. The increased T2 in turn reduces point spread function blurring during acquisition and hence increases the effective resolution at a given image voxel size. Of even greater consequence are the considerably shorter T1 relaxation times at clinical field strengths. Wu et al. [27] and Robson et al. [20] reported phosphorus T1 of 7 and 8.6 s in the tibia at 1.5T, values which are approximately 5-6 times lower than the present ones. Considering that SNR scales as T2/T1 (see Eq. 5 below), operation at 1.5T would entail a relative gain in SNR of a factor of 10, thereby more than offsetting the loss from reduced intrinsic SNR that accompanies the six-fold lower field strength (9.4 versus 1.5T).
Previous studies from the authors’ laboratory of implications of changes in bone water on material properties [7] indicated that an increase in bone water (measured invasively by proton-deuteron exchange NMR) is a direct consequence of decreased bone phosphorus (measured destructively), paralleling the bone’s impaired mechanical properties. These results showed that an increase of 12% in bone water was associated with a 20% reduction of the ultimate strength. These observations emphasize the fact that the present nondestructive method to estimate bone water and hence distinguish undermineralized from normally mineralized bone could provide a new diagnostic technique to quantify hypomineralization. The difference in water content between normally and hypomineralized bone quantified by SSI (12%) was of similar magnitude as that obtained by exchange NMR (9%). Thus, despite the modest significance achieved for this differentiation by solid-state proton MRI (Table 2) in Phase I, the positive correlation with the water quantified by NMR-WATER further highlights the potential of solid-state proton MRI as an means to detect changes mineralization indirectly.
It is noteworthy that the mean water content quantified differed among the three modalities. While SSI-WATER was about 7% lower than that quantified by gravimetry, it was lower by 17% than water content obtained by NMR-WATER. The discrepancy between the quantification values obtained with the different techniques is not surprising considering that they do not sample the same fractions of bone water. Previous work on bone water diffusion [14] suggests a slowly diffusing water component, ascribed to tightly bound collagen water present in the bone. This fraction diffuses approximately four orders of magnitude more slowly than water residing in the lacuno-canalicular system. The most tightly bound portion, while being captured by the NMR exchange method, is likely not being expelled by drying even after 48 hours at 100°C. This portion would have very short T2 (explained in the introduction) and thus, a small fraction, which we estimate to be on the order of 7%, might elude capture by solid-state imaging. Thus it is plausible that while NMR-WATER technique detects all water constituents (except apatite crystal water) via exchange with D2O, a lesser fraction of water is detected gravimetrically after drying and by SSI-WATER. Another possible reason for the discrepancy in the water quantification from the three methods could be regional differences in pore density for the two locations from which the specimens were extracted for measurement with the two different methods. For example, it is known that human cortical bone is weaker on the posterior side suggesting more water being associated with this segment than the lateral and medial sections[30]. Rabbit cortical bone resembles that of humans in several respects, including the architecture of the Haversian system [31]. It is therefore not unreasonable to assume that similar regional differences may exist in the rabbit tibia.
Lastly, it is noteworthy that the DMB and the related properties obtained by the various modalities were lower in the NOII than those in the NOI group. Although the two groups were no different as far as their diets were concerned, the NOII animals were older by about 6 weeks than those of the NOI group (due to the additional eight weeks of the protocol required during which the animals in the HYII comparison group had been subjected to normophosphatemic diet). The more mature age of these animals would suggest higher DMB in the NOII control group. However, we attribute the observed lower values in these animals (compared to NOI controls) to the implications of prolonged cage restriction. It is well known that prolonged containment with movement restriction adversely affects bone mineral density in laboratory animals [32-35]. For example, it has been shown in ovariectomized rats allowed weight-bearing exercise to have significantly increased bone strength compared to animals of similar age not being exposed to exercise [35].
We pointed out previously in the context of comparing treatment and control groups that the various modalities used for quantification measure different properties of mineral and matrix constituents. It is therefore not surprising that for the two control groups involving animals of different age, the relative differences in the various metrics are not the same (Table 1). It is known, for example, that age-related changes in mineral composition can be significant (see, for example, [29] and references cited). Nevertheless, the disparity in the three types of bone water measurement between NOI and NOII control groups (Table 2) is puzzling, and a subject that will require further scrutiny. On the other hand, the detected differences between treatment and their control groups - the principal object of the study - are internally consistent and fully supportive of the hypothesis.
Solid-state proton MRI, as a quantitative imaging modality to study components of bone quality has advantages over 31P MRI. Chief among these is the far better inherent detection sensitivity, caused by the proton’s larger magnetic moment, but even more so the much shorter T1 relaxation time (by two orders of magnitude (<1s versus >50s for 31P at 9.4T)), and the longer T2 (∼500μs versus 100μs). The relative SNR of water protons relative to phosphorus in bone can be readily estimated from the following equation [36]
| (5) |
where γ is the gyromagnetic ratio and N is the number of nuclei per unit volume. By inserting the values for T1 and T2 for 31P and 1H, respectively (∼50/0.5 s and 100/250 μs), and estimating N from the measured weight percentages (∼10% for phosphorus [7, 15] and ∼15% for water protons[7]) we obtain a value of ∼ 20,000 by which proton MRI can be expected to be more sensitive than 31P for imaging bone. Hence, to achieve comparable SNR per unit time, the linear resolution could be increased 27-fold for proton relative to phosphorus MRI. Thus the intrinsically higher SNR of proton MRI results in shorter scan times and allows the measurements to be performed at clinical field strengths in humans making proton MRI of bone attractive, as shown in recent work [12, 37-39]. Techawiboonwong et al [38] quantified cortical bone water in vivo at 3T using long T2 soft-tissue suppression techniques. Wu et al suggested to use multinuclear MRI (31P and 1H) [21] to obtain quantitative information on matrix volume and mineralization density. More recently, Robson et al provided evidence that combined 31P/1H solid-state imaging may be feasible in humans [20] or in laboratory animals in vivo, but more work will be needed to assess the method’s ultimate potential.
Conclusions
This work highlights the potential of phosphorus and proton solid-state magnetic resonance imaging as a new modality for the study of defects of mineral metabolism and its treatment. The method provides detailed insight into the changes in mineral and matrix composition and while the present data were obtained ex vivo in an animal model, the extension to measurements in vivo in animals and humans as a near-term goal is deemed feasible.
Acknowledgements
This work was supported by NIH grant RO1 AR 50068. The authors are indebted to Drs. Maria Fernandez and Alex Wright for useful discussions and Dr. Alex Radin for his assistance with the mechanical testing experiments.
This work was supported by NIH Grant RO1 AR 50068
Footnotes
Publisher's Disclaimer: This is a PDF file of an unedited manuscript that has been accepted for publication. As a service to our customers we are providing this early version of the manuscript. The manuscript will undergo copyediting, typesetting, and review of the resulting proof before it is published in its final citable form. Please note that during the production process errors may be discovered which could affect the content, and all legal disclaimers that apply to the journal pertain.
Contributor Information
SeshaSailaja. Anumula, Laboratory for Structural NMR Imaging, Department of Radiology, University of Pennsylvania Health System, Philadelphia, PA, USA, sailaja.anumula@uphs.upenn.edu
Jeremy Magland, Laboratory for Structural NMR Imaging, Department of Radiology, University of Pennsylvania Health System, Philadelphia, PA, USA, jmagland@uphs.upenn.edu
Suzanne L Wehrli, NMR Core Facility, Children’s Hospital, Philadelphia, PA, USA, wehrli@email.chop.edu
Henry Ong, Laboratory for Structural NMR Imaging, Department of Radiology, University of Pennsylvania Health System, Philadelphia, PA, USA, ongh@seas.upenn.edu.
Hee Kwon Song, Laboratory for Structural NMR Imaging, Department of Radiology, University of Pennsylvania Health System, Philadelphia, PA, USA, hsong@uphs.upenn.edu
Felix W. Wehrli, Laboratory for Structural NMR Imaging, Department of Radiology, University of Pennsylvania Health System, Philadelphia, PA, USA, wehrlif@uphs.upenn.edu
References
- 1.Grynpas M. Age and disease-related changes in the mineral of bone. Calcif Tissue Int. 1993;53(Suppl 1):S57–64. doi: 10.1007/BF01673403. [DOI] [PubMed] [Google Scholar]
- 2.Hammett FS. A biochemical study of bone growth. I. Changes in the Ash, Organic matter and Water during growth. J Biol Chem. 1925;64:409–428. [Google Scholar]
- 3.Elliott SR, Robinson RA. The water content of bone. I. The mass of water, inorganic crystals, organic matrix, and CO2 space components in a unit volume of the dog bone. J Bone Joint Surg Am. 1957;39-A:167–88. [PubMed] [Google Scholar]
- 4.Robinson RA. Chemical analysis and electron microscopy of bone. In: Rodahl K, Nicholson JT, Brown EM, editors. Bone as a Tissue. McGraw-Hill book Company; New York: 1960. p. 186. [Google Scholar]
- 5.Neuman WF, Neuman MW. The Chemical Dynamics of Bone Mineral. University of Chicago Press, IL; Chicago: 1958. Skeletal Dynamics; p. 101. [Google Scholar]
- 6.Garner E, Lakes R, Lee T, Swan C, Brand R. Viscoelastic dissipation in compact bone: Implications for stress-induced fluid flow in bone. J Biomech Eng-Transactions of the ASME. 2000;122:166–172. doi: 10.1115/1.429638. [DOI] [PubMed] [Google Scholar]
- 7.Fernandez-Seara MA, Wehrli SL, Takahashi M, Wehrli FW. Water content measured by proton-deuteron exchange NMR predicts bone mineral density and mechanical properties. J Bone Min Res. 2004;19:289–296. doi: 10.1359/JBMR.0301227. [DOI] [PubMed] [Google Scholar]
- 8.Meunier PJ, Boivin G. Bone mineral density reflects bone mass but also the degree of mineralization of bone: therapeutic implications. Bone. 1997;21:373–377. doi: 10.1016/s8756-3282(97)00170-1. [DOI] [PubMed] [Google Scholar]
- 9.Boyde A, Jones SJ, Aerssens J, Dequeker J. Mineral density quantitation of the human cortical iliac crest by backscattered electron image analysis: variations with age, sex, and degree of osteoarthritis. Bone. 1995;16:619–27. doi: 10.1016/8756-3282(95)00119-x. [DOI] [PubMed] [Google Scholar]
- 10.Peyrin F, Salome M, Nuzzo S, Cloetens P, Laval-Jeantet AM, Baruchel J. Perspectives in three-dimensional analysis of bone samples using synchrotron radiation microtomography. Cell Mol Biol (Noisy-le-grand) 2000;46:1089–102. [PubMed] [Google Scholar]
- 11.Nuzzo S, Peyrin F, Cloetens P, Baruchel J, Boivin G. Quantification of the degree of mineralization of bone in three dimensions using synchrotron radiation microtomography. Med Phys. 2002;29:2672–81. doi: 10.1118/1.1513161. [DOI] [PubMed] [Google Scholar]
- 12.Wu Y, Ackerman JL, Chesler DA, Graham L, Wang Y, Glimcher MJ. Density of organic matrix of native mineralized bone measured by water- and fat-suppressed proton projection MRI. Magn Reson Med. 2003;50:59–68. doi: 10.1002/mrm.10512. [DOI] [PubMed] [Google Scholar]
- 13.Wu Y, Ackerman JL, Chesler DA, Li J, Neer RM, Wang J, Glimcher MJ. Evaluation of bone mineral density using three-dimensional solid state phosphorus-31 NMR projection imaging. Calcif Tissue Int. 1998;62:512–8. doi: 10.1007/s002239900471. [DOI] [PubMed] [Google Scholar]
- 14.Fernandez-Seara MA, Wehrli SL, Wehrli FW. Diffusion of exchangeable water in cortical bone studied by nuclear magnetic resonance. Biophys Journal. 2002;82:522–529. doi: 10.1016/S0006-3495(02)75417-9. [DOI] [PMC free article] [PubMed] [Google Scholar]
- 15.Anumula S, Magland J, Wehrli SL, Zhang H, Ong H, Song HK, Wehrli FW. Measurement of phosphorus content in normal and osteomalacic rabbit bone by solid-state 3D radial imaging. Magn Reson Med. 2006;56:946–52. doi: 10.1002/mrm.21050. [DOI] [PubMed] [Google Scholar]
- 16.Edelstein WA, Hutchison JM, Johnson G, Redpath T. Spin warp NMR imaging and applications to human whole-body imaging. Phys Med Biol. 1980;25:751–6. doi: 10.1088/0031-9155/25/4/017. [DOI] [PubMed] [Google Scholar]
- 17.Emid S, Creyghton JHN. High-Resolution Nmr Imaging in Solids. Physica B & C. 1985;128:81–83. [Google Scholar]
- 18.Beyea SD, Balcom BJ, Mastikhin IV, Bremner TW, Armstrong RL, Grattan-Bellew PE. Imaging of heterogeneous materials with a turbo spin echo single-point imaging technique. J Magn Reson. 2000;144:255–65. doi: 10.1006/jmre.2000.2054. [DOI] [PubMed] [Google Scholar]
- 19.Fernandez-Seara MA, Wehrli SL, Wehrli FW. Multipoint mapping for imaging of semi-solid materials. J Magn Reson. 2003;160:144–150. doi: 10.1016/s1090-7807(02)00136-2. [DOI] [PubMed] [Google Scholar]
- 20.Robson MD, Gatehouse PD, Bydder GM, Neubauer S. Human imaging of phosphorus in cortical and trabecular bone in vivo. Magn Reson Med. 2004;51:888–92. doi: 10.1002/mrm.20055. [DOI] [PubMed] [Google Scholar]
- 21.Wu Y, Chesler DA, Glimcher MJ, Garrido L, Wang J, Jiang HJ, et al. Multinuclear solid-state three-dimensional MRI of bone and synthetic calcium phosphates. Proc Natl Acad Sci U S A. 1999;96:1574–8. doi: 10.1073/pnas.96.4.1574. [DOI] [PMC free article] [PubMed] [Google Scholar]
- 22.Ramanathan C, Ackerman JL. Quantitative solid-state NMR imaging of synthetic calcium phosphate implants. Magn Reson Med. 1999;41:1214–20. doi: 10.1002/(sici)1522-2594(199906)41:6<1214::aid-mrm18>3.0.co;2-h. [DOI] [PubMed] [Google Scholar]
- 23.Glover GH, Pauly JM, Bradshaw KM. B-11 Imaging with a 3-Dimensional Reconstruction Method. J Magn Reson Imaging. 1992;2:47–52. doi: 10.1002/jmri.1880020109. [DOI] [PubMed] [Google Scholar]
- 24.Greengard L, Lee JY. Accelerating the nonuniform fast Fourier transform. Siam Review. 2004;46:443–454. [Google Scholar]
- 25.Gere JM, Timoshenko SP. Mechanics of materials. PWS-KENT Pub. Co.; Boston: 1990. p. xviii.p. 807. [Google Scholar]
- 26.Currey JD. Mechanical consequences of variation in mineral content of bone. J Biomech. 1969;2:1–11. doi: 10.1016/0021-9290(69)90036-0. [DOI] [PubMed] [Google Scholar]
- 27.Wu Y, Ackerman JL, Chesler DA, Wang J, Glimcher MJ. In Vivo Solid State 31P MRI of Human Tibia at 1.5T; Proc ISMRM 8th Scientific Meeting and Exhibition, Proc. of ISMRM 8th Scientific Meeting and Exhibition.1999. p. 213. [Google Scholar]
- 28.Vose GP, Kubala AL. Bone strength—its relationship to X-ray determined ash content. Hum Biol. 1959;31:262–270. [Google Scholar]
- 29.Wu Y, Ackerman JL, Kim HM, Rey C, Barroug A, Glimcher MJ. Nuclear magnetic resonance spin-spin relaxation of the crystals of bone, dental enamel, and synthetic hydroxyapatites. J Bone Miner Res. 2002;17:472–80. doi: 10.1359/jbmr.2002.17.3.472. [DOI] [PubMed] [Google Scholar]
- 30.Currey JD, Brear K, Zioupos P. The effects of ageing and changes in mineral content in degrading the toughness of human femora. J Biomech. 1996;29:257–60. doi: 10.1016/0021-9290(95)00048-8. [DOI] [PubMed] [Google Scholar]
- 31.Martiniakova M, Grosskopf B, Omelka R, Vondrakova M, Bauerova M. Differences among species in compact bone tissue microstructure of mammalian skeleton: use of a discriminant function analysis for species identification. J Forensic Sci. 2006;51:1235–9. doi: 10.1111/j.1556-4029.2006.00260.x. [DOI] [PubMed] [Google Scholar]
- 32.Barengolts EI, Lathon PV, Curry DJ, Kukreja SC. Effects of endurance exercise on bone histomorphometric parameters in intact and ovariectomized rats. Bone Miner. 1994;26:133–40. doi: 10.1016/s0169-6009(08)80058-x. [DOI] [PubMed] [Google Scholar]
- 33.Chen X, Aoki H, Fukui Y. Effect of exercise on the bone strength, bone mineral density, and metal content in rat femurs. Biomed Mater Eng. 2004;14:53–9. [PubMed] [Google Scholar]
- 34.Huang TH, Lin SC, Chang FL, Hsieh SS, Liu SH, Yang RS. Effects of different exercise modes on mineralization, structure, and biomechanical properties of growing bone. J Appl Physiol. 2003;95:300–7. doi: 10.1152/japplphysiol.01076.2002. [DOI] [PubMed] [Google Scholar]
- 35.Honda A, Sogo N, Nagasawa S, Shimizu T, Umemura Y. High-impact exercise strengthens bone in osteopenic ovariectomized rats with the same outcome as Sham rats. J Appl Physiol. 2003;95:1032–7. doi: 10.1152/japplphysiol.00781.2002. [DOI] [PubMed] [Google Scholar]
- 36.Wehrli FW, Fernandez-Seara MA. Nuclear magnetic resonance studies of bone water. Ann Biomed Eng. 2005;33:79–86. doi: 10.1007/s10439-005-8965-8. [DOI] [PubMed] [Google Scholar]
- 37.Wu Y, Dai G, Ackerman JL, Hrovat MI, Glimcher MJ, Snyder BD, et al. Water- and fat-suppressed proton projection MRI (WASPI) of rat femur bone. Magn Reson Med. 2007;57:554–67. doi: 10.1002/mrm.21174. [DOI] [PubMed] [Google Scholar]
- 38.Techawiboonwong A, Song HK, Wehrli FW. In vivo MRI of submillisecond T2 species with two-dimensional and three-dimensional radial sequences and applications to the measurement of cortical bone water. NMR Biomed. 2007 doi: 10.1002/nbm.1179. [DOI] [PubMed] [Google Scholar]
- 39.Robson MD, Bydder GM. Clinical ultrashort echo time imaging of bone and other connective tissues. NMR Biomed. 2006;19:765–80. doi: 10.1002/nbm.1100. [DOI] [PubMed] [Google Scholar]


