
Figure 4 b.
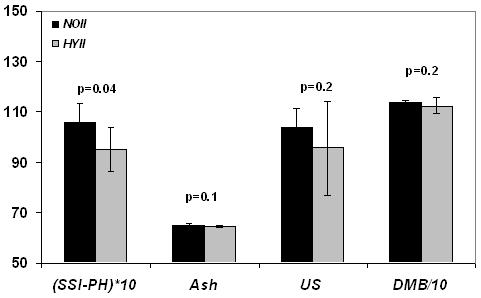
Same measures as in Figure 4a comparing hypophosphatemic (HYII) and control group (NOII) in phase II indicating partial recovery of HYII animals upon return to normophosphatemic diet.
Official websites use .gov
A
.gov website belongs to an official
government organization in the United States.
Secure .gov websites use HTTPS
A lock (
) or https:// means you've safely
connected to the .gov website. Share sensitive
information only on official, secure websites.
Same measures as in Figure 4a comparing hypophosphatemic (HYII) and control group (NOII) in phase II indicating partial recovery of HYII animals upon return to normophosphatemic diet.