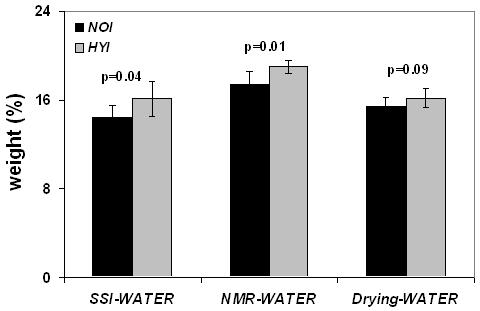
Figure 5 a.

Group differences showing higher water content quantified by solid state 1H MRI (SSI-WATER) (wt%), exchange NMR (NMR-WATER) (wt%) and gravimetry (Drying-WATER) (wt%) in the hypophosphatemic group (HYI) as compared to the same age control group (NOI) in phase I. Bars indicate mean±SD and p represents the statistical significance.
