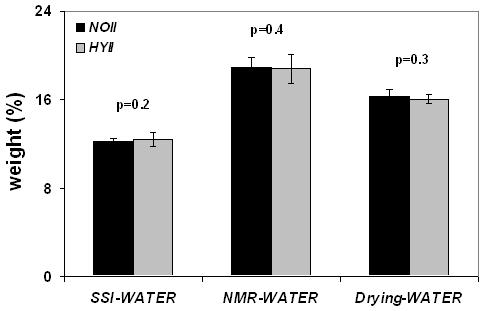
Figure 5 b.

Same measures as in Figure 5a comparing hypophosphatemic (HYII) and control group (NOII) in phase II indicating partial recovery of HYII animals upon return to normophosphatemic diet.

Same measures as in Figure 5a comparing hypophosphatemic (HYII) and control group (NOII) in phase II indicating partial recovery of HYII animals upon return to normophosphatemic diet.