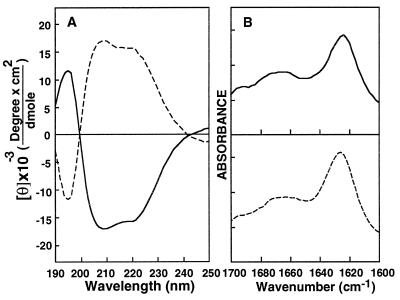
Figure 2.
(A) CD spectra of WT (solid line) and WT-D (dashed line) peptides in 40% trifluoroethanol. (B) ATR-FTIR spectra of the peptides in POPG multibilayers. The samples were prepared as described in Material and Methods; peptide/lipid molar ratio was 1:80. The spectra were analyzed by using the curve fitting of the amide I band area assuming Voight line shapes for the IR peaks. Solid line, WT; dashed line, WT-D.

