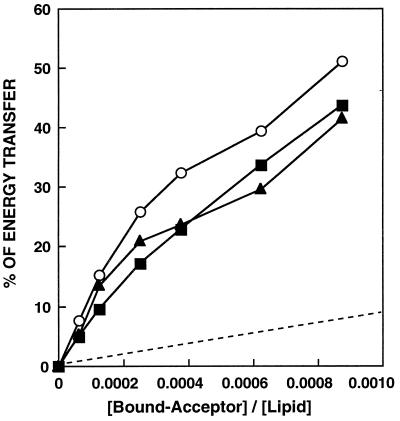
Figure 4.
Fluorescence energy transfer dependence on NBD-labeled peptide acceptor concentration. The spectra were obtained for the donor peptide alone or in the presence of various amounts of an acceptor peptide. Each spectrum was recorded in the presence of 400 μM POPG-SUV in PBS. The excitation wavelength was set at 467 nm; emission was scanned from 500 to 600 nm. Transfer efficiencies between donor- and acceptor-WT (squares), donor- and acceptor-WT-D (triangles), and donor-WT and acceptor-WT-D (circles) are plotted versus the bound-acceptor/lipid molar ratio. A theoretical plot showing energy transfer efficiency as a function of the surface density of the acceptors, assuming random distribution of donors and acceptors and assuming R0 = 51Å, is given for comparison (dashed line).

