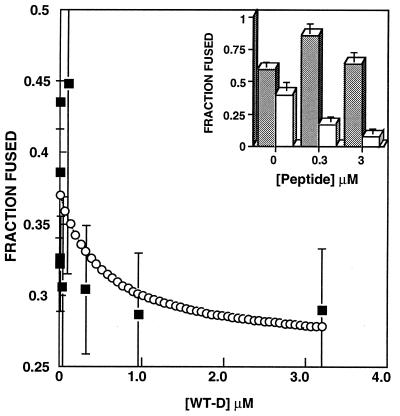
Figure 5.
Percentage fusion of TF228 cells to SupT1 cells versus peptide concentration for WT-D. The two cell types were incubated together for 2 hr before video fluorescence microscopy images were taken. Only TF228 cells in contact with SupT1 cells were counted. Empty circles, curve–fit to the lipid mixing data according to Equation 1, with ɛ = 0.81 μM and KI = 0.4 μM. (Inset) Histograms of percentage fusion of HeLa cells expressing HIV-2 gp41 (filled columns) and HIV-1 gp41 (empty columns) versus WT-D concentration.

