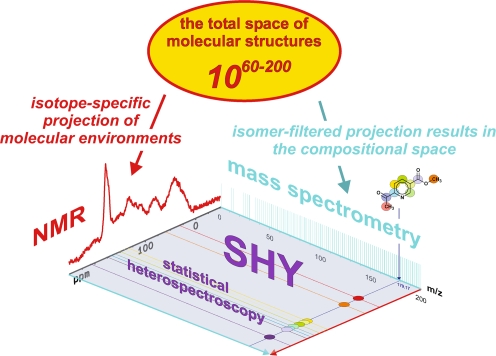
Fig. 7.
Molecular-level resolution spectroscopic data represent projections of the vast total structural space of molecules, for which count estimates range from 1060 to 10200 [72]. The complementarity of NMR spectroscopy and mass spectrometry for the spectral characterisation of intricate materials is caused by the entirely different atomic and molecular processes that these methods rely upon (Fig. 6). Mass spectra reflect the isomer-filtered complement of the entire space of molecular structures. The compositional space of molecules can be probed with ultrahigh-resolution FTICR mass spectroscopy, resulting in single peaks for molecules (in the absence of fragmentation). NMR spectra represent site- and isotope-specific projections of the molecular environments (the projected NMR spectrum given here shows a 13C NMR spectrum for an aquatic NOM). Accordingly, typical organic molecules exhibit single mass peaks (molecular ions given here: C9H9NO3) and more elaborate NMR signatures (13C NMR data are shown here for C9H9NO3; see also Fig. 6). Because these atomic and molecular signatures are not entirely orthogonal, the data provided by NMR and MS show correlations that can be used to reconstruct chemical structures by empirical and mathematical back-projection. In mixture analysis, separation offers a (near-)orthogonal means of expanding the two-dimensional spectroscopic projection area into a three-dimensional analytical volumetric pixel space (see Fig. 12). Following separation, molecules that often exhibit wide concentration variances in mixtures can be investigated by combined NMR/MS, with acquisition parameters specifically adapted in order to maintain the optimum dynamic range, which is necessary for good-quality spectra

