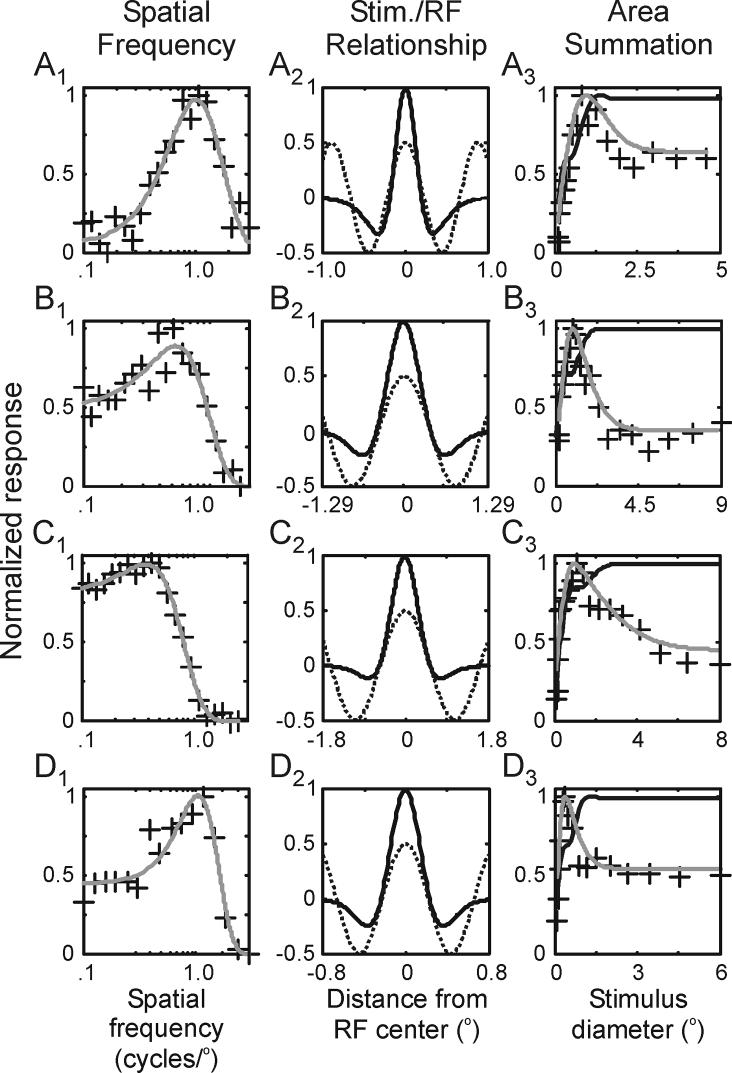
Figure 2.
Estimating the contribution of linear suppression to area summation tuning curves. A1, B1, C1, D1. Spatial frequency tuning curves from 4 representative neurons fitted to a frequency-domain difference of Gaussians (DOGf) equation (lines). A2, B2, C2, D2. DOG receptive field profiles of the 4 representative neurons (dark lines) along with the luminance profiles of the sine-wave gratings used in the area summation experiments (dashed gray lines). A3, B3, C3, D3. Estimated area summation tuning curves based on the classical receptive fields of the 4 representative neurons (dark lines) along with their measured tuning curves (gray lines).

