
Figure 7.
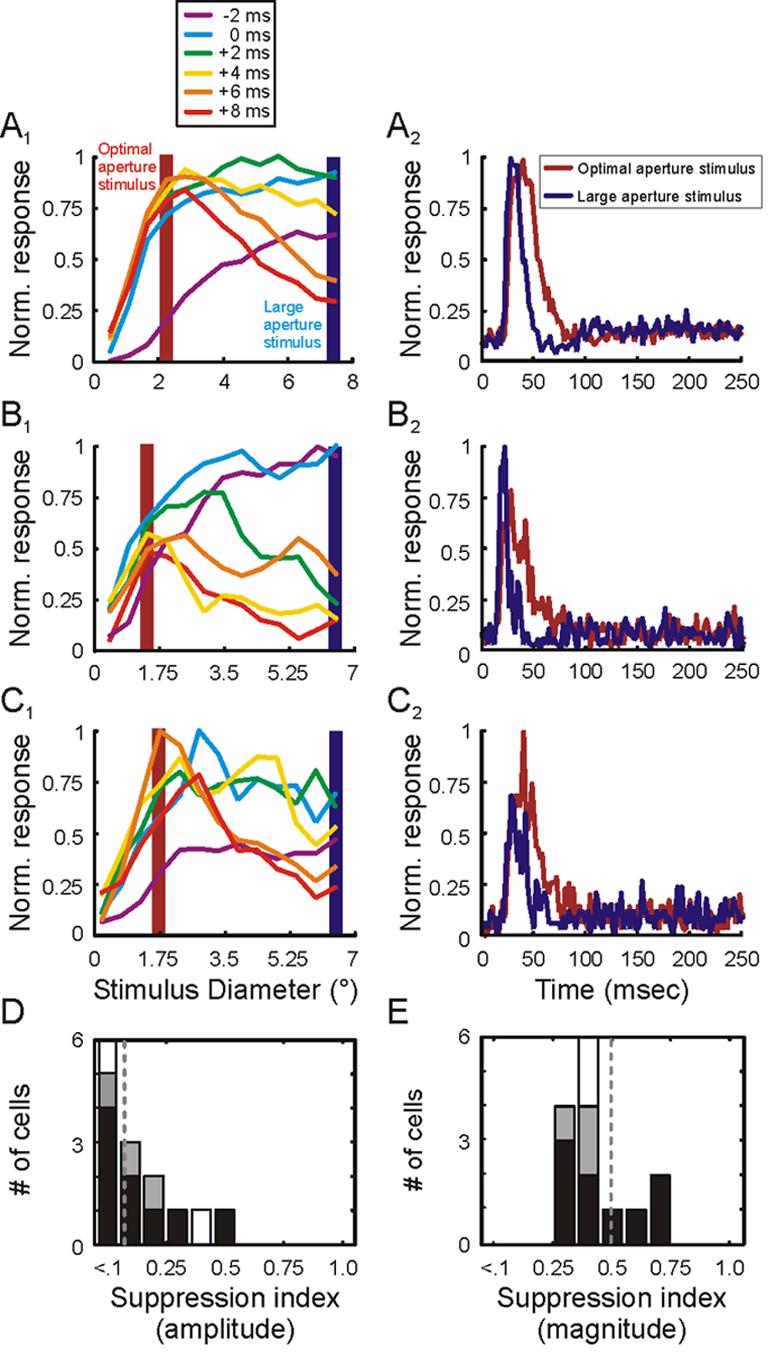
Temporal dynamics of area summation in the retina. A1, B1, C1. Area summation tuning curves for 3 representative retinal ganglion cells at 6 different relative times. The time when cells reached 25% of maximum response is defined as 0 msec. Each of the colored curves represents responses at times relative to 0 msec. Shaded red and blue bars highlight responses to optimal-size stimuli and large stimuli, respectively. A2, B2, C2. Time course of responses to optimal-size stimuli (red traces) and large stimuli (blue traces) for the 3 representative ganglion cells. D and E. Distribution of suppression index values using amplitude (D) and magnitude (E) measures from each cell's area summation tuning curve. Magnocellular neurons represented in black, parvocellular neurons represented in gray, unclassified neurons represented in white.