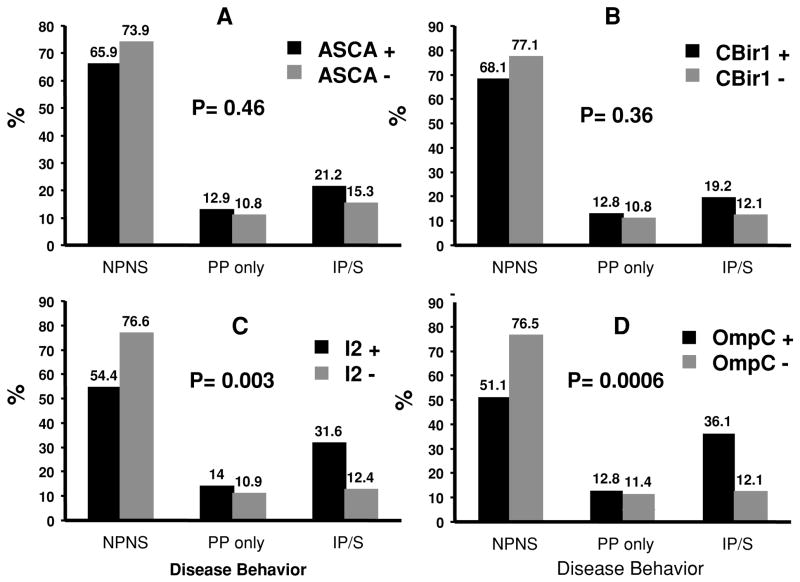
Figure 1.
Graphs A–D illustrate the percentage for the different disease behaviors among those seropositive and seronegative for the specific immune response. There are no differences in the distribution of disease behaviors among ASCA (A) and CBir1 (B) positive or negative patients. There are significant increases in frequency of IP/S in patients positive for anti-I2 (C) and anti-OmpC (D). NPNS = nonpenetrating nonstricturing; PP = perianal perforating only; IP/S = internal penetrating and/or stricturing.

