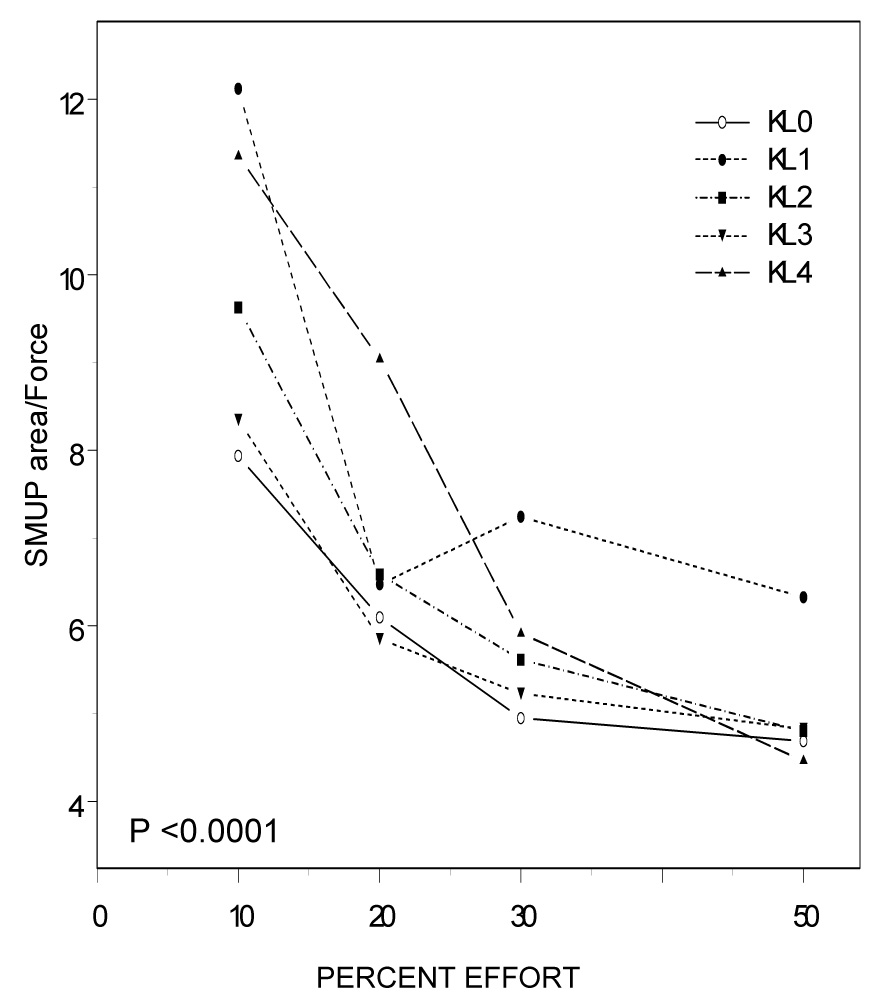
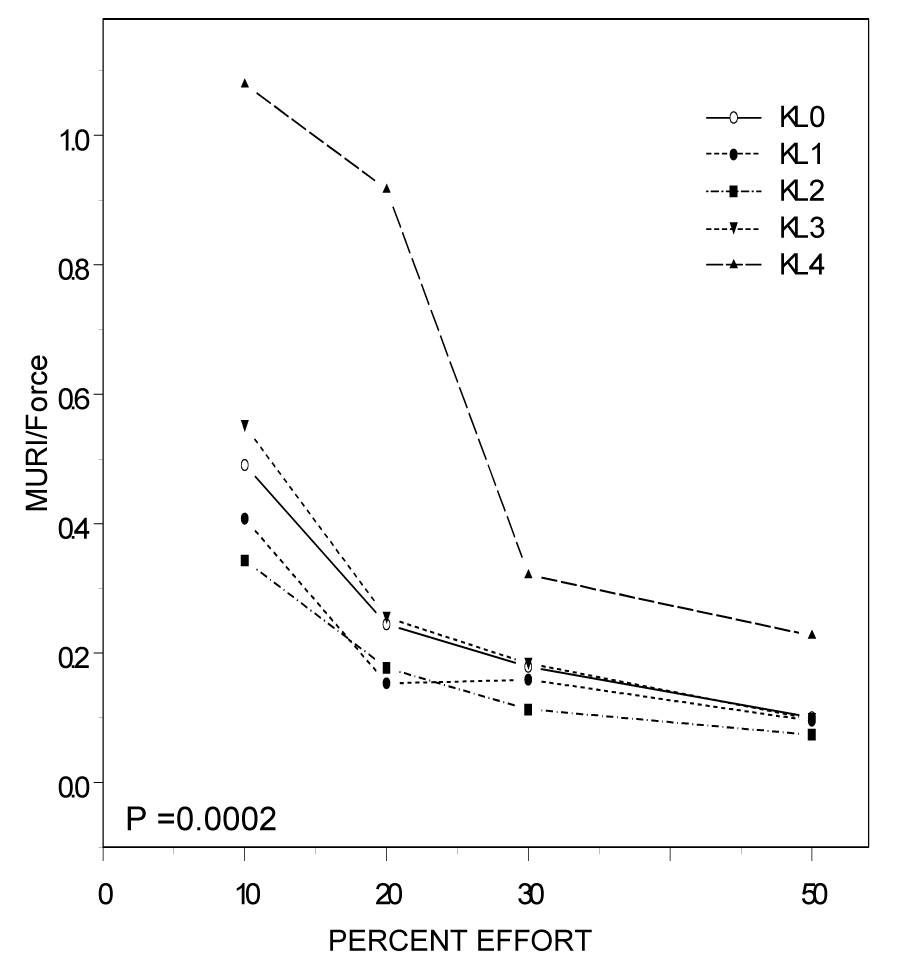
Figure 2.


Figure 2A: Surface Detected Motor Unit Action Potential (S-MUAP) per Force (Uv*MSEC/N) by %Effort and Kellgren & Lawrence (KL) Grade Effort-related changes in S-MUAP area per unit force differed significantly by OA grade (P<0.0001). Specifically, OA group differences in S-MUAP area per unit force were most prominent at lower effort levels.
Figure 2B: Motor Unit Recruitment Index (MURI; 1/N) by %Effort and Kellgren & Lawrence (KL) Grade MURI per unit force changed differently as %effort increased by OA grade (P=0.0002). Interestingly, at lower effort levels MURI per unit force was significantly higher in participants with more severe radiographic OA and lower in participants with less severe disease.
