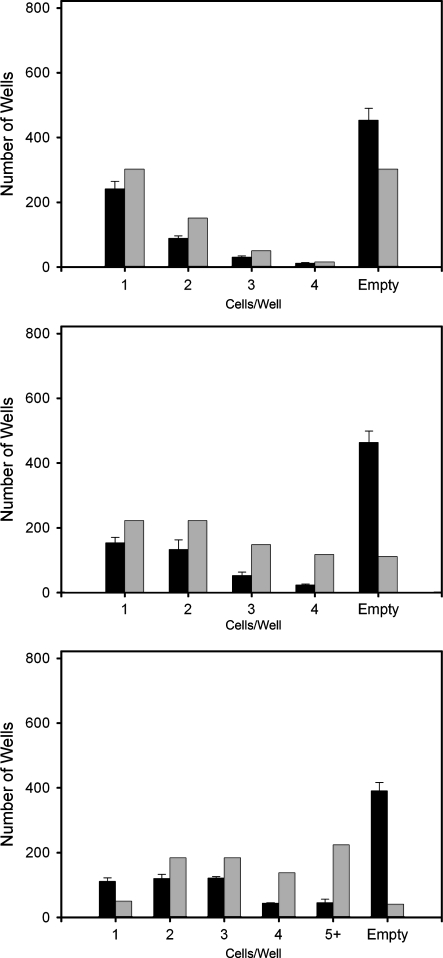
Fig. 3.
Cell distribution in gel wells as a function of seeding density. The number of wells containing n cells is plotted (from top to bottom) for initial seeding densities of 822, 1,644, and 2,466 cells. Experimentally observed data (black bars); predictions based on probability theory (gray bars)

