
Figure 1.
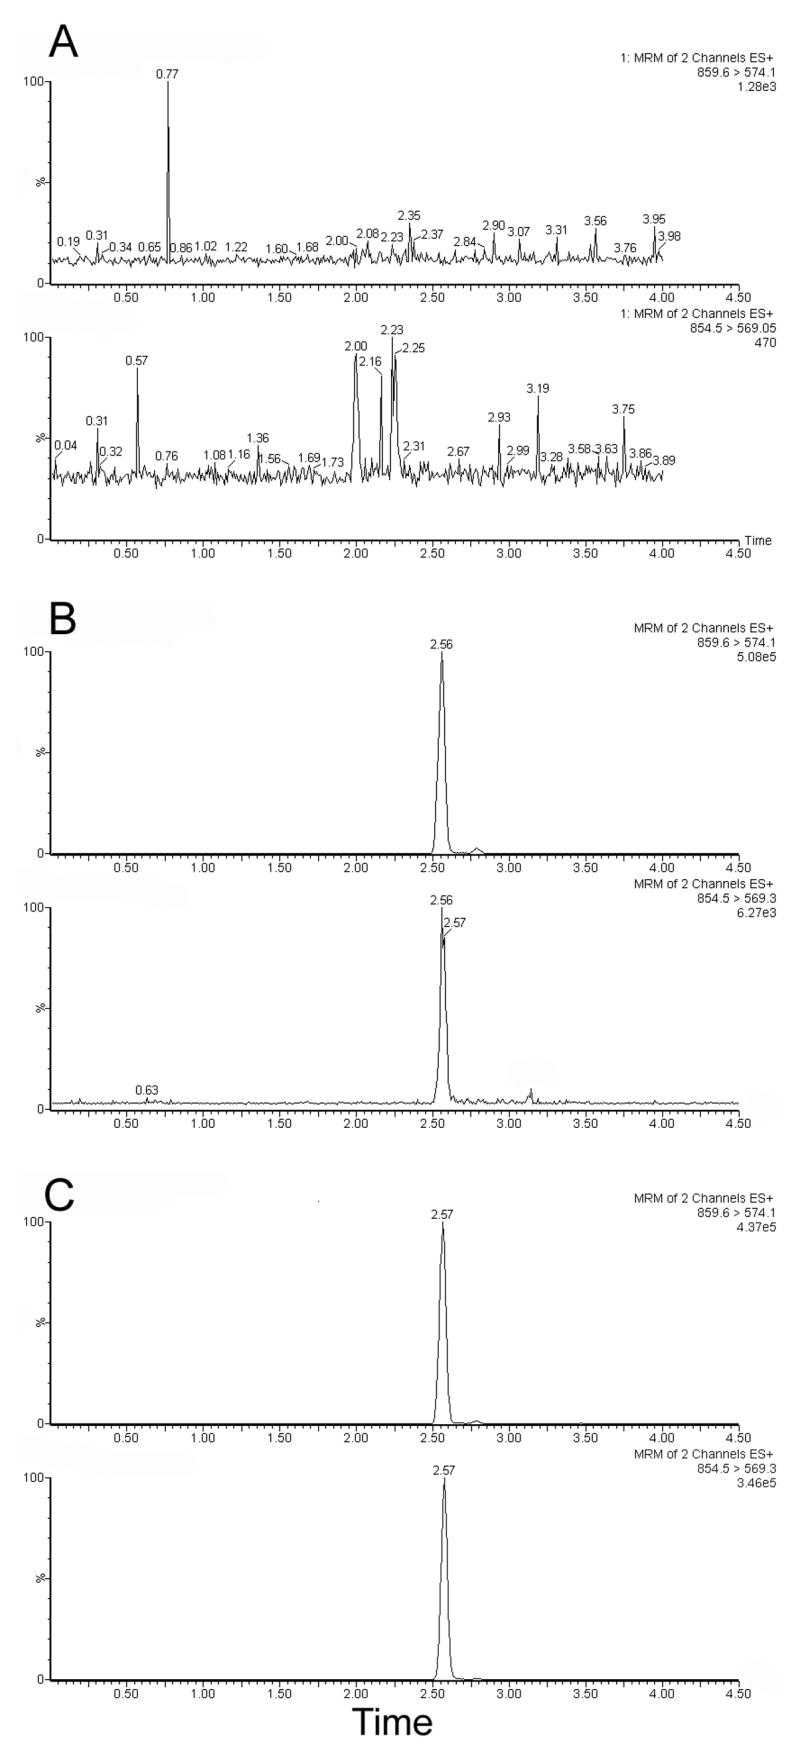
Single ion chromatograms of A) Blank plasma; B) 10 ng/mL paclitaxel in plasma; C) A patient sample, drawn 1.5 hrs after the start of a 30 min infusion of 260 mg/m2 ABI-007. The calculated concentration of this sample is 1100.7 ng/mL. Each chromatogram depicts two traces; the 859.6>574.1 transition for d5-paclitaxel, the internal standard, and the 854.5>569.05 transition for paclitaxel. Each trace is normalized to the highest peak, and absolute signal is shown on the right.