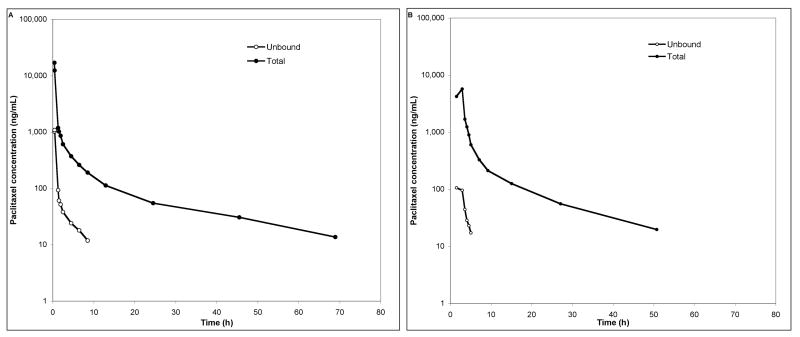
Figure 2.
A) Plasma concentration-time profile for a representative individual that received 260 mg/m2 ABI-007 as a 30 min infusion. B) Plasma concentration-time profile for the same individual, after receiving 175 mg/m2 Taxol as a 3 h infusion, in a separate cycle of treatment. Solid dots represents total paclitaxel; open circles represents unbound paclitaxel.

