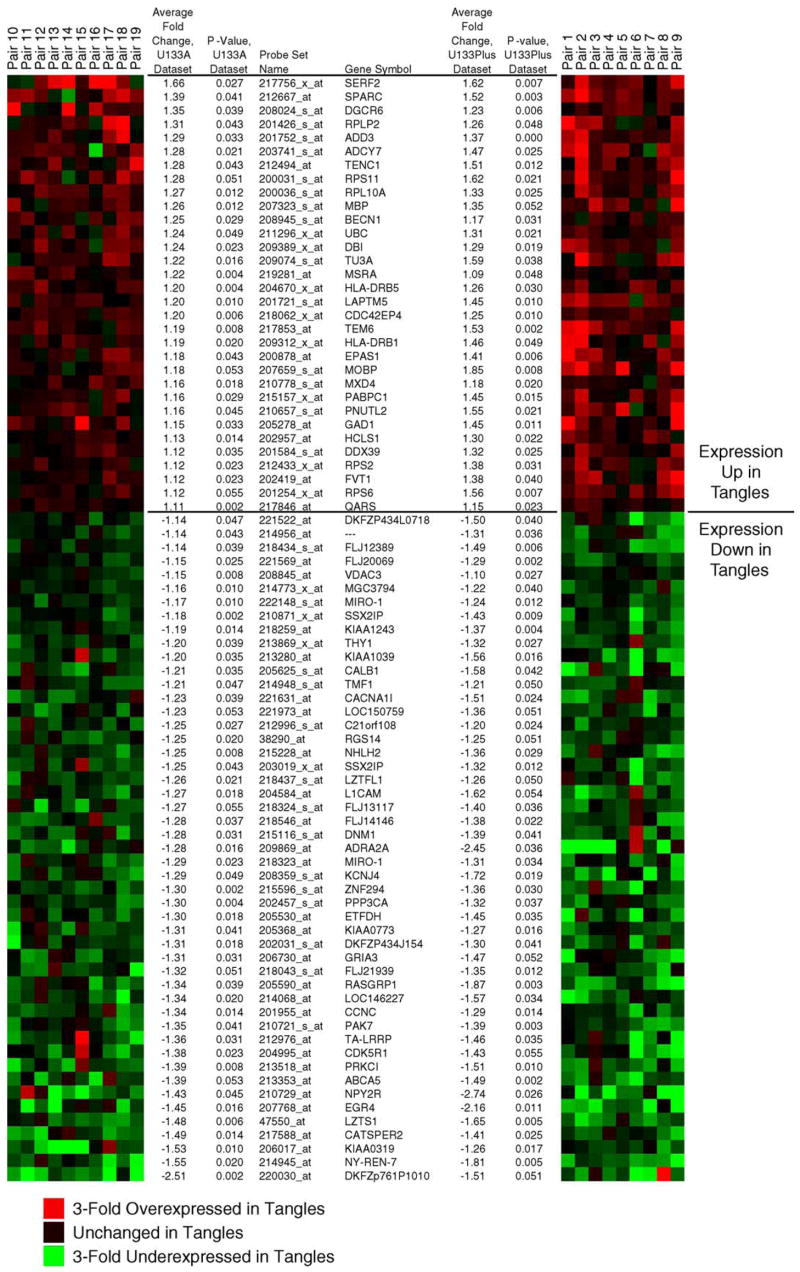
Fig. 3.
Statistically significant genes are consistently dysregulated across the data sets. Shown are heat maps illustrating fold change values for the indicated genes in each patient-matched pair of histopathologically normal neurons (control) and neurofibrillary tangle-containing neurons (tangled). The left heat map represents genes from the initial analysis on Affymetrix U133A arrays and the right heat map shows the results for the replicate data set analyzed on U133 plus 2.0 arrays. Genes that were repressed in tangled neurons relative to controls are colored in green and induced genes are colored in red. Provided are the unique probe IDs for each gene, the gene symbol, average fold change between classes, and permutational P values for each replicate data set. Cluster representation was generated using GeneCluster (http://rana.lbl.gov/EisenSoftware.htm). log2-fold-differences for each sample pair for each gene were imported into GeneCluster and complete linkage clustering performed without clustering either arrays or genes.

