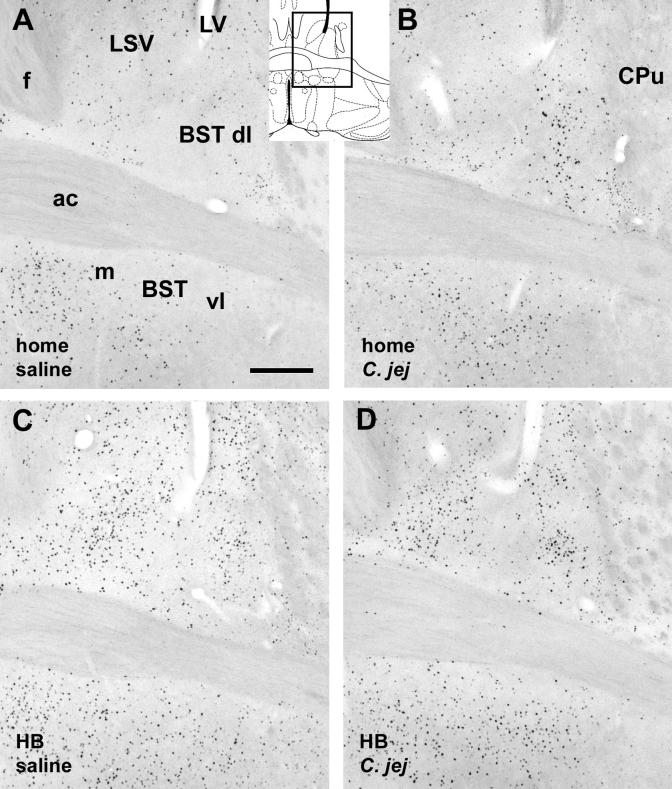
Fig. 5.
Photomicrographs of the bed nucleus of the stria terminalis (A-D), showing increase in c-Fos-immunoreactive cells in response to C. jejuni challenge (predominantly in the dorso- and ventrolateral parts) and to holeboard exposure. Each panel depicts one of the four experimental conditions indicated in the bottom left of the panels. Insert depicting a diagram of a brain section shows the location of the photomicrographs (modified after Paxinos and Franklin, 2001). Abbreviations: ac: anterior commissure; BST: bed nucleus of the stria terminalis, dl: dorsolateral part, vl: ventrolateral part; m: medial part; C. jej: treated with C. jejuni; CPu: caudate putamen; f: fornix; HB: holeboard exposure: LSV: lateral septal nucleus, ventral part. Scale bar in A: 250 μm, applies to all panels.

