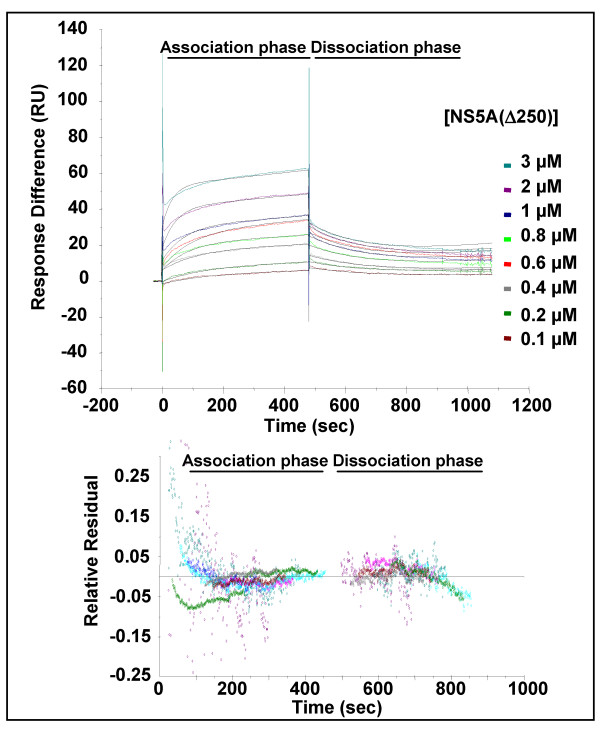
Figure 3.
Surface plasmon resonance analysis of the NS5A(Δ250):Fyn SH3 domain interaction. SPR analysis was performed as described for NS5A(Δ250) and GST-FynSH3. The indicated concentrations of NS5A were flowed over a sensor cell on to which GST-FynSH3 was captured via an anti-GST antibody. The generated fit is shown as black lines in the top panels, the residuals plotted in the lower panels indicate the relative response difference between the generated fit and the raw data – demonstrating the closeness of fit.

