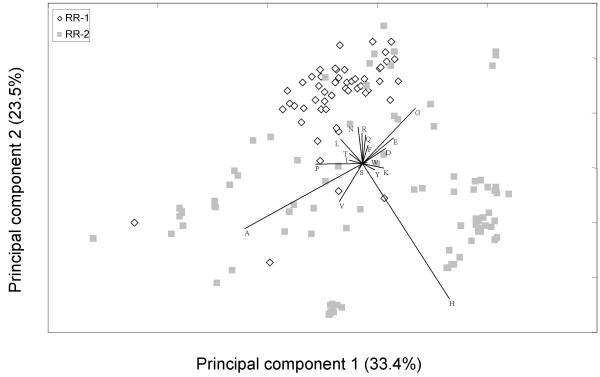
Figure 4.
Scatterplot representing variation in amino-acid content of all putative An. gambiae CPR proteins. The horizontal and vertical axes are the first and second principal components, respectively, of the amino-acid composition matrix after removal of the predicted signal peptide. The labeled vectors indicate the relative loadings of each amino acid in the first and second principal components. The amino acids cysteine and methionine, which are scarce in mature CPR proteins (0.03 and 0.4% respectively), were excluded from the composition matrix. The percentage of the total variation explained by each axis is also given. RR-1 and RR-2 proteins are indicated separately according to the legend. PC axis 1 and 2 = 33.4 + 23.5 = 57% of total variation. The major loadings for the first five PC axes (82% of the variation) are: A, H, G-Q, V, Q-Y. RR-1 and RR-2 are strongly separated on the second axis and RR-2s have more variation overall.

