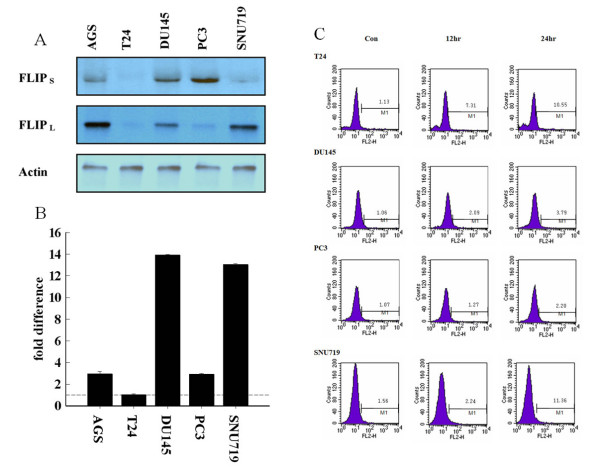
Figure 1.
The expression levels of c-FLIPS indicate a relationship to resistance to TNF-induced apoptosis. (A) Immunoblotting analysis of c-FLIPL and c-FLIPS in TNF-α-resistant and TNF-α-sensitive cell lines with anti-FLIPL and anti-FLIPS antibodies. The molecular weights of c-FLIPL and c-FLIPS were about 55 kDa and 28 kDa, respectively. β-Actin was used as a loading control. (B) Differences in the expression levels of c-FLIPS between various cancer cell lines shown by quantitative real-time PCR and SYBR Green detection. Levels of c-FLIPS were normalized to GAPDH and the fold changes in c-FLIPS levels are shown for each cell line. Data shown are the average of two assays. PCR products were analyzed using Sequence Detection software. Error bars equal the SEM. (C) Measurement of TNF-α-induced apoptosis using the TUNEL assay (M, TUNEL positive) in different human cancer cell lines. Different patterns are shown following treatment with TNF-α (10 ng/ml) at 0, 12, and 24 h.

